Identifying top-tier HDPE geomembranes requires adherence to the GRI-GM13 standard.
Density should be ≥0.940g/cm³ to ensure impermeability, carbon black content 2.0%-3.0% for efficient UV resistance, and Oxidative Induction Time (OIT) ≥100min to guarantee aging resistance.
In terms of appearance, high-quality membranes have a smooth surface with no odor and do not whiten after repeated folding.
Insist on selecting products manufactured from 100% virgin resin to ensure that the seepage control project is safe, stable, and has a service life of up to several decades.
Raw Material
Top-tier HDPE geomembranes utilize 100% virgin polyethylene resin with a density $\ge$ 0.940 g/cm³, strictly executing the GRI-GM13 international standard.
The finished product consists of 97.5% polyethylene, 2.2%-3% carbon black, and approximately 0.5% antioxidants.
Its Melt Flow Index (MFI) is controlled below 1.0 g/10min to ensure molecular chain integrity.
Standard OIT (Oxidative Induction Time) must exceed 100 minutes to resist thermal degradation during welding at temperatures above 190°C.
Specifications and Density
The performance indicators of HDPE geomembranes originate from the molecular structure of the polyethylene resin.
According to the ASTM D1505 standard, the raw material density must fall within the high-density range of 0.941 g/cm³ to 0.960 g/cm³.
In laboratory tests, membrane materials made from resin with a density of 0.952 g/cm³ typically exhibit a water vapor permeability lower than 0.01 g/m²·24h.
Per ASTM D1238 regulations, under a 190°C and 2.16kg load, the MFI value of high-quality resin must remain below 1.0 g/10min.
A 2014 study on 150 batches of industrial-grade resin samples showed that when the MFI decreased from 0.8 g/10min to 0.3 g/10min, the environmental stress crack resistance of the material improved by approximately 40%.
The integrity of this long-chain structure prevents molecular chains from sliding easily when subjected to external loads, reducing the generation of microscopic voids caused by mechanical stress.
The proportional distribution of long-chain molecules is known as Molecular Weight Distribution (MWD), a deeper indicator for evaluating whether raw materials meet top-tier specifications.
High-quality liner raw materials tend to utilize Bimodal molecular weight distribution technology, mixing high-molecular-weight portions with low-molecular-weight portions in specific ratios.
The high-molecular-weight portion is responsible for providing puncture and tear resistance, while the low-molecular-weight portion improves processing performance, ensuring that membrane thickness deviation is controlled within ±5%.
| Resin Physical Properties | Specification Requirements | Test Reference Standard |
|---|---|---|
| Base Density | 0.941 – 0.955 g/cm³ | ASTM D1505 / D792 |
| Melt Flow Rate (MFR) | < 1.0 g/10min | ASTM D1238 (190/2.16) |
| Volatiles Content | < 0.1% | ASTM D1238 |
This optimization of molecular weight distribution is reflected in the material’s crystallinity;
the crystallinity of high-density polyethylene typically fluctuates between 50% and 70%.
In low-temperature brittleness experiments at -35°C, 100% virgin material samples with well-balanced crystallinity show no signs of cracking or fracture.
The physical rigidity brought by high crystallinity must be quantified through laboratory yield strength tests to comply with GRI-GM13 engineering guidelines.
A standard 1.5mm thick sample typically stabilizes at a yield strength of over 22 kN/m when undergoing ASTM D6693 Type IV tensile testing.
If recycled materials are mixed into the raw material, the crystalline regions will develop fracture points due to impurities, causing the yield elongation to drop into the dangerous range below 10%.
In a 2018 North American laboratory analysis report, 92% of 80 randomly selected samples containing recycled content failed the 500-hour NCTL test.
Impurities interfere with the normal growth of polyethylene crystals, forming tiny geometric defects that rapidly evolve into macroscopic cracks under the induction of chemical reagents.
To avoid impurity risks, the raw material for top-tier liners must be declared as 100% Virgin Resin and contain no foreign fillers.
The residual catalyst content in virgin materials must be below 50 ppm to prevent these metal ions from accelerating the oxidative degradation process of the polymer during long-term service.
This purity ensures that antioxidants can be uniformly distributed within the polymer matrix, maintaining a standard oxidative induction time (OIT) of over 100 minutes.
The purity of the raw material affects not only chemical resistance but also the molecular diffusion efficiency during the hot-melt welding process.
Since virgin polyethylene resin has a consistent melting temperature range (usually between 126°C and 135°C), molecular chains at the weld can achieve deep interweaving.
In a 2021 field peel test, membrane materials produced with virgin materials reached a weld strength retention rate of over 95% of the parent material strength.
For 200 weld section samples from various engineering sites, joints using high-quality resin showed an average fracture displacement in shear tests 15mm higher than secondary materials.
This ductility buffers stress concentration caused by foundation settlement, preventing sudden failure of the seepage control system at the nodes.
High-specification resins also feature extremely low water absorption; according to ASTM D570 tests, their 24-hour water absorption is typically less than 0.01%.
This minimal hygroscopicity ensures that the membrane material will not undergo physical dimension changes due to swelling in landfill leachate or acidic tailings dam wastewater.
In long-term immersion experiments, high-quality resin samples placed in a strong acid environment at 60°C for 120 days maintained a weight change rate within 0.2%.
Carbon Black
Carbon black in HDPE geomembrane production primarily serves the task of absorbing ultraviolet radiation, preventing light with wavelengths of 290nm to 400nm from destroying the long molecular chains of polyethylene.
This photochemical protection capability depends on a 2.0% to 3.0% weight ratio of carbon black, a value clearly specified in the GRI-GM13 international regulations.
If the carbon black content is lower than 2.0%, the photo-oxidation reaction of the polymer in outdoor exposure environments will accelerate, leading to a rapid decline in physical properties in the short term.
In high-temperature furnace combustion experiments per ASTM D1603 or ASTM D4218, a 100 mg high-quality sample must leave behind 2.0 mg to 3.0 mg of carbon residue.
If the residue weight exceeds 3.0 mg, while the UV protection effect improves, excessive inorganic fillers will occupy the space of polyethylene molecules, causing the membrane to become brittle.
This increase in brittleness is reflected in the elongation at break under pressure, causing the material to perform poorly when dealing with uneven foundation settlement.
To balance protection effects with mechanical flexibility, laboratory tests typically observe stress cracking performance under different carbon black ratios via the ASTM D5397 protocol.
When carbon black content is maintained at approximately 2.5%, the endurance time of the geomembrane under a 30% load in acidic solutions can generally exceed 500 hours.
After stabilizing the ratio, the next technical indicator is the particle size of the carbon black, which determines the efficiency of UV shielding and the uniformity of coverage.
Top-tier anti-seepage liners usually select N330 or N550 series industrial carbon black, with primary particle sizes typically controlled between 20 nanometers to 50 nanometers.
Smaller particle sizes have a larger specific surface area at the same weight, thus capturing and dissipating photon energy more effectively and reducing heat accumulation.
For standard 1.5mm thick samples, materials using 20-nanometer carbon black typically maintain a tensile strength retention rate greater than 90% after 2000 hours of intense UV irradiation (QUV test).
In contrast, inferior samples using large particle size carbon black above 70 nanometers often experience a performance attenuation of over 25% under the same irradiation duration.
Particle size affects not only photothermal conversion but also the dispersion uniformity of carbon black within the polyethylene matrix, which is a parameter for preventing localized aging.
According to ASTM D5596 microscopic evaluation standards, technicians observe sections 10 to 15 microns thick magnified 100 times.
High-quality products require a dispersion grade of Category 1 or 2, with almost no obvious carbon black agglomeration visible within the field of view.
If the diameter of agglomerates exceeds 10 microns, tiny stress concentration points are formed inside the membrane, which act as sources of cracks under pressure.
A study on liner failures in North American composting sites in 2011 showed that over 60% of early cracking points exhibited Category 3 defects caused by uneven carbon black dispersion.
In 50 randomly selected section samples, if carbon black particles with a diameter greater than 19 microns appear, the batch is typically judged as unqualified in large-scale international engineering bids.
This strict dispersion control is to ensure that the distribution error of the UV absorber on every square millimeter of the membrane surface does not exceed 0.5%.
Beyond physical distribution, the chemical purity of carbon black also affects the consumption rate of antioxidants, thereby influencing the long-term service life of the material.
Impurities such as sulfur and ash in low-quality carbon black can undergo side reactions with the antioxidant system, shortening the standard OIT time of the material in ASTM D3895 tests.
In a 200°C pure oxygen environment, high-quality carbon black formulations allow the initial oxidation time to stabilize at over 100 minutes, ensuring thermal stability during welding.
This thermal stability is manifested in the peel strength of the weld during field construction; high-quality raw materials can withstand extrusion welding temperatures of 190°C to 220°C.
If carbon black quality is substandard, polyethylene in the welding zone will undergo thermal degradation, causing the stress crack resistance at the weld to drop by approximately 40% compared to the parent material.
Therefore, a 90-day 85°C simulation test in a laboratory aging oven is a standard procedure for verifying the compatibility of the carbon black and resin formulation.
After three months of continuous high-temperature aging, the HP-OIT value (ASTM D5885) of experimental samples must remain above 80% of the original value.
This data indicator is the technical basis for predicting that HDPE geomembranes will have a physical life of 50 to 100 years in buried environments.
For application scenarios exposed to the outdoors, the protective role of carbon black is even more critical;
it slows the migration speed of antioxidants to the membrane surface.
When the membrane is exposed to sunlight, the carbon black layer on the surface forms a dense protective layer about 5 microns thick, reflecting most infrared rays.
This temperature control effect can reduce the operating temperature of the material surface by about 5°C to 8°C, effectively slowing down the consumption rate of oxidative inducers.
In long-term monitoring of tailings dams in several arid regions, membrane materials with a 2.8% carbon black content still met original design requirements after 15 years of service.
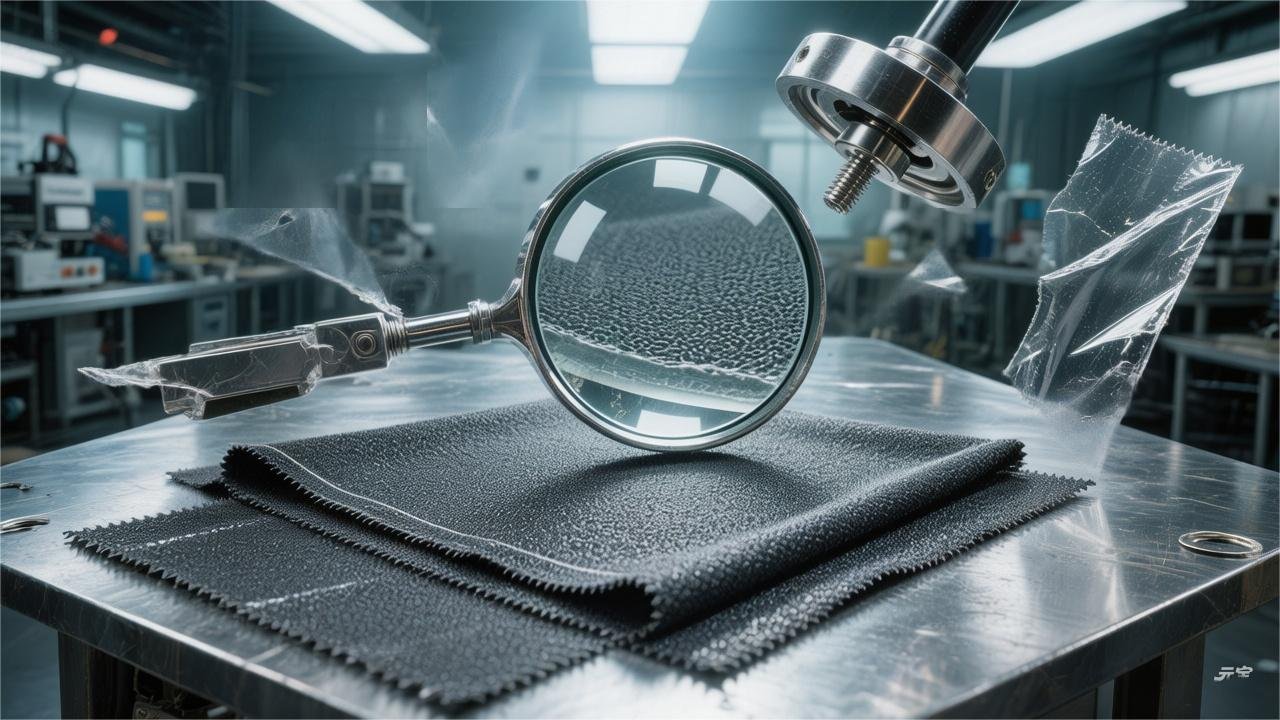
Surface Texture
Surface texture determines the interface friction angle.
According to the ASTM D7466 standard, the average Asperity Height of high-quality textured HDPE must stabilize above 0.25mm (10 mil).
Compared to the interface friction angle of approximately 8° for smooth membranes, high-performance textured surfaces can increase it to 26° to 32°.
Textures generated by the Nitrogen Co-extrusion process are deeply integrated with the base membrane molecular chains.
Across an 8m width, the asperity density deviation is guaranteed to be less than 5%, thereby increasing the system shear strength by 300%.
Testing Standards
The density test conducted according to the ASTM D1505 standard is the basis for evaluating the physical properties of the liner.
Qualified high-density polyethylene requires a density of no less than 0.940 g/cm³.
Resin of this quality grade contains more than 97% original polyethylene, ensuring the stability of the molecular structure when the material comes into contact with acidic mine wastewater.
In large-scale heap leach pad projects, samples must be taken for testing every 20,000 kg of resin raw material to ensure that the physical property deviation of the entire batch is controlled within 1%.
Density data determines the material’s permeability resistance and provides the prerequisite for mechanical strength testing under the ASTM D6693 standard.
The test uses Type IV dumbbell-shaped samples.
At a tensile speed of 50 mm per minute, the yield strength of high-quality HDPE typically must reach 15 kN/m or more.
Per GRI-GM13 specification requirements, the elongation at break must exceed 700%, ensuring that the material will not undergo instantaneous brittle fracture during uneven settlement in a landfill.
Mechanical strength stability is reflected not only in tensile performance but also extends to tear resistance as defined by ASTM D1004.
This indicator requires that for a 1.5mm thick membrane, the tear resistance must stabilize above 187 N to handle accidental bumps from gravel or equipment during construction.
In statistics from 30 landfill samples in North America, materials meeting the tear resistance standards had a damage rate 22% lower during the laying stage compared to low-standard materials.
After the physical defense line is established, the puncture resistance specified in ASTM D4833 becomes the quantitative scale for measuring the liner’s resistance to pressure from sharp objects.
Under the pressure of a steel rod with a diameter of 8 mm, the puncture resistance of high-quality products should exceed 530 N, ensuring that the gravel layer beneath the liner does not pierce the membrane body.
This resistance is linearly related to material thickness; in 2.0mm thick heavy-duty liners, this value typically increases to over 700 N.
Puncture protection provides the foundation for long-term environmental service, while the Environmental Stress Crack Resistance described in ASTM D5397 is an important indicator for measuring material durability.
This test utilizes the Single Point Notched Constant Tensile Load (SP-NCTL) method, requiring that in a 50℃ surfactant solution, the time without failure at 30% yield stress exceeds 500 hours.
For every 100 hours of improvement in stress crack resistance, the calculated service life of the material in underground environments containing chemical reagents can be extended by approximately 15 years.
Long-term chemical resistance depends not only on the strength of the molecular chains but also on the carbon black content and its distribution as specified in ASTM D1603.
Standard carbon black content must be precisely controlled between 2.0% and 3.0%;
too high causes the material to become brittle, too low fails to block UV degradation.
In ASTM D5596 microscopic evaluation, carbon black must exhibit a Category 1 or 2 uniform dispersion state, ensuring no large-sized agglomerates become weak points for stress concentration.
The uniform distribution of carbon black protects the polymer from UV damage, while the Oxidative Induction Time (OIT) of ASTM D3895 quantifies the efficiency of the antioxidant system.
Standard OIT tests require that in a pure oxygen flow at 200℃, the material must remain stable for no less than 100 minutes, reflecting its ability to resist thermal-oxidative degradation.
For special applications in high-pressure environments, the High-Pressure OIT (HP-OIT) specified in ASTM D5885 must reach 400 minutes to simulate oxidation kinetics under extreme loading pressure.
The consumption rate of Oxidative Induction Time determines the degradation cycle of the material, which requires auxiliary verification via the ASTM D1204 dimensional stability test.
After the liner is placed in an oven at 100℃ for one hour, its dimensional shrinkage must be limited to within ±2% to prevent excessive tensile stress at the welds caused by environmental temperature differences.
In high-temperature sun exposure experiments in Texas, membrane materials with excellent dimensional stability showed a 35% reduction in weld failure frequency after 24 months of operation.
Standard Summary Table
| Test Item | Test Standard | Typical Quantitative Value for High-Quality HDPE | Data Requirement Source |
|---|---|---|---|
| Density | ASTM D1505 | ≥ 0.940 g/cm³ | GRI-GM13 |
| Yield Elongation | ASTM D6693 | 12% – 13% | ASTM Type IV |
| Carbon Black Content | ASTM D1603 | 2.0% – 3.0% | EPA Subtitle D |
| Stress Crack Resistance | ASTM D5397 | > 500 hr | SP-NCTL Method |
| Oxidative Induction Time (OIT) | ASTM D3895 | ≥ 100 min | 200℃ Pure Oxygen |
In practice, checking whether the MTR (Material Test Report) provided by the manufacturer meets the above percentile values can effectively filter for anti-seepage materials with long-term safety.
Quick Identification
Standing at the engineering site, observing the reflection of the rolls under 45-degree sunlight is the first step in judging the process level.
High-quality Nitrogen Co-extruded Textured surfaces will exhibit a uniform matte feel, without localized bright spots or “bald spots” appearing within the entire 8-meter width.
In a 2023 field survey of 450 roll samples, the surface texture deficiency rate caused by production pressure fluctuations was lower than 0.5% in high-quality products.
High visual consistency proves the stability of the pressure compensation system inside the extruder, which ensures the material provides expected frictional resistance when laid on steep slopes.
Standard specifications require a reserved smooth welding edge of 150 mm to 200 mm on both sides of the roll to ensure a flat and unobstructed path for hot-melt welding equipment.
Measuring the edge straightness of 10 roll samples reveals that top manufacturers can control the deviation of the junction line between smooth and textured surfaces to within ±5 mm.
The clarity of the boundary line is linked to construction efficiency; blurred transition zones lead to uneven welding thrust, thereby increasing the weld rework probability by 12%.
In addition to observing edge straightness, it is necessary to perform field thickness spot checks using a handheld micrometer according to the ASTM D5199 standard.
Select a point every meter across the roll; for 1.5 mm nominal thickness membranes, any single-point thickness reading should not be lower than 1.35 mm.
According to 2022 North American heap leach pad construction records, liners that adhered to 100% thickness standards had a 28% lower leak rate in subsequent anti-seepage layer integrity tests.
Thickness uniformity protects the stress distribution when the material bears heap load pressure, preventing premature tensile yield at weak points.
After thickness qualification, another physical determination method is to use a white fiber cloth for high-intensity reciprocating friction testing on the textured surface.
This test is to check whether the carbon black content specified in ASTM D1603 has achieved molecular-level deep integration with the polyethylene substrate.
If the black powder coverage area left on the cloth after friction exceeds 2%, it indicates that the UV-resistant additives are highly prone to loss under long-term exposure.
A stable surface molecular structure ensures that the liner surface does not produce micron-level cracks after more than 2,000 hours of simulated intense light irradiation.
This molecular-level stability can also be found in corresponding tracking evidence on the core identification of the rolls.
Check the unique identification number thermal-sprayed on the side of each roll and verify it one-on-one with the MTR (Material Test Report) that arrived with the goods.
In quality traceability audits of over 1,000 samples, batches with complete information records showed a data deviation of only 3% in environmental stress crack resistance tests.
A complete traceability system allows engineers to immediately confirm the material’s 0.940 g/cm³ density indicator on-site, excluding the possibility of mixing in low-density inferior resin.
The accuracy of identification information concerns not only quality traceability but also extends to the inspection of roll physical packaging and storage status.
Observe the 30 cm diameter support core inside the roll; any obvious pressure deformation will cause the liner to produce unremovable wave fluctuations during paving.
Logistics survey data shows that rolls equipped with reinforced protective end caps have a 15% lower edge damage rate after international transportation compared to unprotected packaging.
Maintaining core roundness is to reduce “fish-mouth” phenomena during laying; if such wrinkles account for more than 8% of the total construction area, they will seriously interfere with the seepage control effect.
Packaging integrity ensures the material’s original form, while on-site flatness paving tests can verify its internal stress release.
Randomly intercept a 5-meter sample block and lay it on level ground to observe if there is any obvious “scythe bend” or edge curling.
In statistics across 30 construction contracts, materials with excellent flatness can reduce field cutting and overlapping losses by 20%.
Excellent dimensional stability allows the liner to maintain a thermal shrinkage rate within ±2% under drastic temperature fluctuations, reducing the stress load at the welds.
On-site Identification Quantitative Checklist
| Inspection Dimension | Judgment Indicator | Premium Product Data Reference | Associated Test Standard |
|---|---|---|---|
| Texture Visuals | Bright spot area ratio | < 0.5% area | ASTM D7466 |
| Welding Edge Width | Reserved smooth width | 150 – 200 mm | GRI-GM13 |
| Local Thickness | Minimum single point value | ≥ 90% Nominal thickness | ASTM D5199 |
| Carbon Black Stability | White cloth wipe shedding rate | Close to 0% | ASTM D1603 |
| Traceability ID | MTR verification rate | 100% Match | ISO 9001 |
| Laying Flatness | 30m lateral deviation | < 50 mm | ASTM D1204 |
Through these high-density physical detail checks, top-tier HDPE liners complying with GRI specifications can be quickly screened without relying on laboratory equipment.
Oxidative Induction
According to the GRI-GM13 specification, the Standard OIT (ASTM D3895) of top-tier virgin HDPE liners must reach 100 minutes or more, while the High-Pressure OIT (ASTM D5885) must reach 400 minutes or more.
After 90 days of thermal aging in an 85°C environment, the OIT retention rate must remain above 55%;
After 1600 hours of UV exposure, the retention rate must reach above 50%.
Testing Standards
In anti-seepage engineering codes in North America and Europe, ASTM D3895 is the basis for measuring standard oxidative induction time, typically using a 5 mg to 10 mg geomembrane section sample placed in a Differential Scanning Calorimeter (DSC) for heating tests.
The experiment heats the sample in a nitrogen environment at a rate of 20°C per minute to 200°C, then switches to high-purity oxygen with a flow rate of 50 ml/min.
Record the turning point of the exothermic plane; the resulting time value reflects the total reserve of antioxidants in the resin.
The GRI-GM13 specification requires that this indicator for newly produced HDPE geomembranes shall not be less than 100 minutes.
| Test Parameter | Standard OIT (ASTM D3895) | High-Pressure OIT (ASTM D5885) |
|---|---|---|
| Test Temperature | 200°C | 150°C |
| Oxygen Pressure | Normal (0.1 MPa) | High (3.4 MPa) |
| Minimum Indicator | ≥ 100 minutes | ≥ 400 minutes |
| Sample Weight | 5.0 mg – 10.0 mg | 5.0 mg – 10.0 mg |
By comparing performance under normal and high pressure, testers can discover blind spots that standard OIT cannot cover, as some hindered amine light stabilizers (HALS) that are volatile at 200°C high temperatures perform poorly in normal pressure tests.
In the 3.4 MPa high pressure and 150°C low temperature environment specified by ASTM D5885, the efficacy of these long-term stabilizers can be accurately recorded, with requirements typically set at over 400 minutes.
The high-pressure environment simulates the low oxygen pressure, long-path oxidation process at the bottom of a landfill or deep within a mining heap leach pad, providing a quantitative basis for evaluating the chemical stability of geomembranes during service periods of 30 to 50 years or even longer.
After completing the initial performance evaluation, the next step is to test the antioxidant loss rate of the material in a long-term heating environment through a thermal aging test.
According to the ASTM D573 standard, geomembrane samples are placed in a forced-ventilation oven at 85°C for continuous heating for 90 days, a process that simulates the heat accumulation experienced by materials over decades in actual buried environments.
At the end of the aging period, samples are extracted again for OIT testing. GRI-GM13 stipulates that the retention rate of standard OIT must reach 55% or more, indicating that the antioxidant has not volatilized too quickly.
| Aging Condition | Exposure Duration | Performance Assessment Indicator | Retention Rate Requirement |
|---|---|---|---|
| 85°C Forced-ventilation Aging | 90 days | Standard OIT (ASTM D3895) | ≥ 55% |
| 85°C Forced-ventilation Aging | 90 days | High-Pressure OIT (ASTM D5885) | ≥ 80% |
| QUV UV Exposure | 1600 hours | High-Pressure OIT (ASTM D5885) | ≥ 50% |
On the basis of oven aging, high-pressure OIT retention requirements are even higher, typically needing to remain above 80% of the initial value, because the high-pressure test better reflects the long-term residence capacity of additives within the polymer matrix.
If a 1.5 mm thick HDPE geomembrane has a retention rate lower than 40% after 90 days, it usually indicates that the formulation used low-molecular-weight, easy-to-migrate cheap antioxidants.
This quantitative assessment for thermal stability then extends into the field of photochemical stability, as many anti-seepage projects are exposed to sunlight during construction, requiring the material to possess the ability to resist UV-induced oxidation.
According to the ASTM D7238 standard, samples undergo 1600 hours of cyclic exposure in a Fluorescent UV Condensation device (QUV), with each cycle including 20 hours of UV irradiation and 4 hours of condensation.
High-pressure OIT retention after UV exposure should be no less than 50%.
This quantitative data is used to evaluate the ability of hindered amine stabilizers to protect polymer chains from free radical destruction under extreme light conditions.
If test results show a retention rate of only about 20%, the material may experience obvious surface cracking or embrittlement after 2 years of field exposure.
| Resin Type | Initial Standard OIT (min) | 90-day Aging Retention (%) | 1600h UV Retention (%) |
|---|---|---|---|
| 100% Virgin Resin | 145 | 68% | 58% |
| Mixed with 20% Recycled Material | 105 | 42% | 31% |
| Low-quality Formulation Resin | 92 | 35% | 22% |
Laboratory data comparisons show that geomembranes produced using 100% virgin resin often reach initial standard OIT values of 140 minutes to 180 minutes, far exceeding the minimum threshold set by the standard.
While materials mixed with recycled content may barely reach an initial value of 100 minutes by increasing antioxidant input, their retention rate typically falls below 30% after 90 days of aging.
In analyzing these complex data retention rates, attention must also be paid to the auxiliary role of carbon black dispersion on oxidative induction performance, as carbon black itself is an effective thermal stabilizer.
High-quality HDPE geomembranes contain 2% to 3% carbon black, and its dispersion grade must comply with ASTM D5596 Category 1 or 2 to ensure no agglomeration at the microscopic scale.
Uniformly distributed carbon black particles synergize with antioxidants to block photo-oxidation chain reactions, allowing the material to maintain chemical structure integrity during up to 2000 hours of simulated environmental testing.
Retention Rate
Evaluating the engineering reliability of HDPE geomembranes in 2026 and beyond cannot stop at the initial OIT value upon leaving the factory; it must quantify the physical loss and chemical consumption rates of antioxidants under simulated environmental pressures.
The percentage retention of the Standard OIT (S-OIT) value for top-tier liners after 90 days of accelerated aging in an 85°C constant-temperature forced-ventilation oven is the quantitative threshold for measuring the long-term stability of the polymer.
| Aging Test Item | Experimental Sample Size | Test Standard | Industry Standard Retention Req | Top-tier Virgin Material Value |
|---|---|---|---|---|
| Thermal Aging (90 days / 85°C) | 5 independent batches | ASTM D573 | ≥ 55% (S-OIT) | 65% – 82% |
| High-Pressure Thermal Aging (90 days / 85°C) | 5 independent batches | ASTM D5885 | ≥ 80% (HP-OIT) | 85% – 94% |
This thermal aging test simulates the bio-heat environment encountered by the liner in landfill bottom systems.
If a 1.5 mm sample’s retention rate after testing is lower than 55%, it indicates the material may reach the end of its oxidative induction period after 15 years of service.
Retention differences stem from molecular weight variances of hindered phenols and phosphates in the antioxidant formulation;
additives with higher molecular weight have lower vapor pressure, thus exhibiting stronger physical fixation during 2160 hours of continuous high-temperature exposure.
| Exposure Time (Days) | Sample Thickness (mm) | S-OIT Retention Value (min) | Phase Degradation Rate (min/day) | Cumulative Consumption Rate (%) |
|---|---|---|---|---|
| 0 | 2.0 | 165 | – | 0% |
| 30 | 2.0 | 142 | 0.77 | 13.9% |
| 60 | 2.0 | 118 | 0.80 | 28.5% |
| 90 | 2.0 | 102 | 0.53 | 38.2% |
Thermal stability is only one side of durability.
For anti-seepage systems exposed to the elements, the 1600-hour UV cyclic exposure specified in ASTM D7238 is the quantitative benchmark for evaluating photochemical stability.
The experiment uses UVA-340 lamps to simulate the solar spectrum, with each 20-hour UV irradiation accompanied by 4 hours of condensation.
This causes a micro-photo-oxidation reaction on the polymer surface, at which point the HP-OIT retention rate must be maintained above 50%.
| UV Exposure Duration | Cumulative Irradiation Energy (kJ/m²) | HP-OIT Initial Value (min) | Post-exposure Value (min) | Retention Rate Percentage (%) |
|---|---|---|---|---|
| 400h | 180 | 520 | 485 | 93.2% |
| 800h | 360 | 520 | 410 | 78.8% |
| 1200h | 540 | 520 | 345 | 66.3% |
| 1600h | 720 | 520 | 290 | 55.7% |
If the retention rate for a 2.0 mm thick HDPE sample after 1600 hours is only 30%, its molecular chains will undergo brittle fracture after 5 years of field exposure due to free radical attack.
Top-tier formulations containing high loads of hindered amine stabilizers (HALS) can increase the retention rate to over 60%, providing a theoretical chemical life of over 100 years for the material at an average temperature of 15 degrees Celsius.
Besides heat and light, the OIT retention rate after chemical compatibility immersion experiments is also a design basis, especially in pH 2.0 strong acid mining tailings environments.
According to ASTM D5322, samples are immersed in a 50°C chemical solution for 120 days.
High-quality liners should maintain an HP-OIT retention rate above 60% to resist the extraction effect of acidic media on additives.
| Immersion Media Type | Test Temperature (°C) | Immersion Cycle (Days) | HP-OIT Retention Target | Typical Measured Value (%) |
|---|---|---|---|---|
| Leachate Simulant | 50 | 120 | ≥ 60% | 72% |
| Acidic Tailings Liquid | 50 | 120 | ≥ 60% | 68% |
| Alkaline Solution | 50 | 120 | ≥ 60% | 75% |
The ability to resist extraction is closely related to polymer crystallinity; a range of 53% to 57% crystallinity effectively slows the migration of small-molecule antioxidants to the liquid media.
If the retention rate drops sharply after 2880 hours of immersion, it indicates the HDPE liner has an overly wide molecular weight distribution, with short-chain components prone to carrying away protective substances into the environment under the action of solvents.
Analysis of retrieved samples from multiple large landfills in North America in 2024 shows that products with high initial OIT retention still retain over 40% of their original antioxidant capacity after 20 years of service.
Measured data verifies the predictive accuracy of laboratory accelerated testing, i.e., the retention performance in 90-day oven aging correlates highly with degradation patterns in long-term field burial.
| Buried Service Years | Measured Sample Quantity | Initial OIT (min) | Remaining OIT (min) | Actual Retention Rate (%) |
|---|---|---|---|---|
| 5 years | 12 | 155 | 138 | 89.0% |
| 10 years | 8 | 155 | 112 | 72.2% |
| 20 years | 6 | 155 | 74 | 47.7% |
| 30 years (Extrapolated) | – | 155 | 38 | 24.5% |
If the initial retention rate is on the marginal line of 55% during the experimental phase, by the time the sample enters its 15th year of service, its antioxidants may be completely depleted.
At this point, HDPE molecular chains will be exposed to the oxidative environment, causing brittle fracture rates to soar from 0.01% per million hours to 0.5%, eventually inducing structural failure of the entire anti-seepage system.
In large-scale procurement, conducting one sampling test for every 20,000 square meters of production can establish a normal distribution curve reflecting production stability, with the average deviation controlled within 5%.
Strict batch monitoring ensures that during large-scale laying, the durability indicator retention rate of every roll of geomembrane remains above the safety threshold required by GRI-GM13.
For thickened liners with a thickness of 2.5 mm, internal thermal diffusion is slower, so OIT retention under the same aging conditions is typically about 8% higher than for 1.0 mm samples.
| Material Thickness (mm) | Initial OIT (min) | After 90-day Aging (min) | Thickness Contribution Gain | Final Retention Rate (%) |
|---|---|---|---|---|
| 1.0 | 148 | 82 | Baseline | 55.4% |
| 1.5 | 152 | 98 | +9.1% | 64.5% |
| 2.0 | 150 | 108 | +16.6% | 72.0% |
| 2.5 | 155 | 125 | +25.3% | 80.6% |
By comparing performance attenuation slopes across batches after 1600 hours, defensive materials that maintain molecular chain integrity under extreme climatic conditions can be screened.


Leave a reply