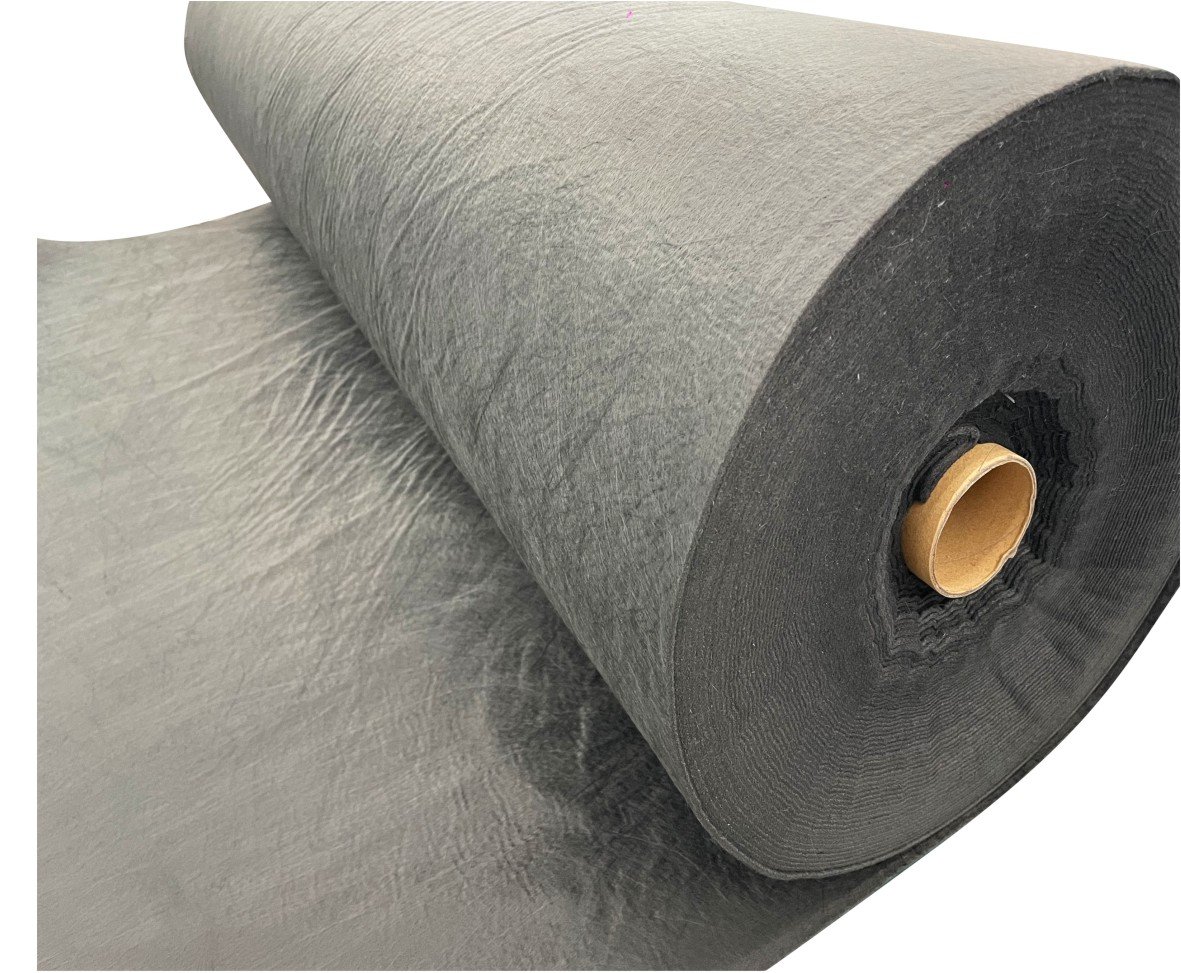
In mining seepage control projects, Reinforced geomembranes and Unreinforced geomembranes each have their own applicable scenarios. Reinforced geomembranes contain a high-strength fabric layer inside, with tensile strength typically reaching 40–80 kN/m and tear resistance improved by approximately 30–50%, making them suitable for high-stress areas such as tailings dams and heap leach pads.
In contrast, unreinforced HDPE geomembranes offer better ductility, with elongation at break reaching 600–800%, making them more suitable for mining areas with significant substrate settlement.
In practical projects, HDPE membranes with a thickness of 1.5–2.0 mm are the most common, as they balance cost and safety while ensuring a permeability coefficient of ≤1×10⁻¹³ cm/s.
Puncture and Tear Resistance
In mining liner projects, users are first concerned not with a single strength figure from a laboratory, but with whether the geomembrane will be punctured, cut, or continue to tear within 24 hours, 30 days, or 3 years after being laid on coarse-grained substrates, gravel corners, weld transition zones, and vehicle construction paths.
On-site, punctures mostly come from point loads, while tearing occurs more often when existing small wounds continue to expand. For the same 1.5 mm membrane, the final damage rate can vary several times depending on the substrate stone particle size, compaction degree, protective geotextile weight, and covering sequence.
Things That Can Damage the Membrane
A piece of breccia with a particle size of 25–50 mm, if it has one sharp corner protruding 8–15 mm above the substrate surface, may have an actual contact area of only a few square millimeters after the overlying load is transmitted. If 300–600 mm of soil cover, self-weight hydraulic pressure, or equipment rolling is superimposed on the same position, the membrane surface does not bear uniform pressure but local indentation. In many mining areas, the first things seen after laying are not through-holes, but indentations, whitening, surface scratches, and local thinning, which then develop into punctures or crack extensions.
Common damage paths in projects often start from the substrate. Even if design drawings specify a “smooth subgrade,” the site may still have 10–75 mm gravel, hard ridges after construction rolling, desiccation cracks formed after drying, or high points pressed by tracks and buckets. For 1.5 mm grade membrane materials, if the substrate height difference locally exceeds 10 mm, voids and bridging will occur after the membrane is laid.
During subsequent backfilling, the upper load will press the membrane toward the convex points, making the local elongation larger than the surrounding area; over time, strain concentration will appear on both sides of the convex points on the membrane surface.
Look at the three most common on-site sources first; much damage occurs here:
- Substrate and Bedding
- Breccia with a particle size of 20–50 mm: if the corners are not blunted, the risk of indentation increases significantly.
- Hard ridges formed after rolling: the width may only be 30–80 mm, but it is enough to cause local bridging of the membrane.
- Desiccation cracks in dry soil layers 5–20 mm wide: discontinuous support will form after backfilling.
- Trench edges, slope toe transitions, and anchor trench openings are the most likely places for high points and sharp edges to remain.
- Construction Equipment and Manual Operation
- The ground pressure of small tracked equipment is commonly 30–60 kPa, and it will be higher locally when turning.
- During lifting, dragging, and pulling the membrane, the edge areas will repeatedly rub against the substrate.
- When workers straighten wrinkles, an instantaneous stretching of 2%–8% may occur locally.
- Tools, welder cables, and temporary clamps dropping onto the membrane surface can easily cause initial surface cuts.
- Covering and Operation Stages
- If the initial soil cover thickness is less than 150–300 mm, point load buffering is usually insufficient.
- When a coarse-grained drainage layer contacts the membrane surface, static loads will gradually press out indentations.
- Sliding of cover material on the slope creates continuous tension on the welds and fixed edges.
- Repeated pressing caused by liquid level changes after filling makes it easier for local weak points to continue expanding.
Puncture does not necessarily come from a “stab” first; many times, what happens first is a “scratch.” During the process of unfolding, positioning, pulling back, and relaying, the membrane produces long-distance friction with the substrate. If the laying area reaches thousands of square meters, even if only 1%–3% of the area undergoes secondary dragging, the cumulative scratch length will be considerable.
The depth of surface scratches may not penetrate immediately, but once a cut of 2–10 mm is formed, as soon as tension arises, the crack will run along the processing direction, laying direction, or stress direction. On-site patches are often concentrated within 300 mm of the overlap edge because this area undergoes dragging, adjustment, and welding heat effects.
Many people underestimate the impact of “equipment routes” on the membrane. Even if the equipment does not travel on the bare membrane, the load will be transmitted down as long as it rolls on thin soil cover. Take a common working condition: a 200 mm protective layer is first laid on the membrane, and then small equipment is used to organize the surface. If 15–40 mm gravel is mixed in the protective layer particles, wheel or track loads will continue to press the coarse particles toward the membrane surface, resulting in “puncture through the soil layer.”
During on-site sampling, it is common to see local thinning of the geotextile and circular or sharp indentations on the membrane surface. The indentation depth may only be a few hundredths of a millimeter to a few millimeters, but strain whitening and precursors of surface cracking have already begun to appear in the surrounding area.
Later, problems at detailed locations will be amplified. The membrane does not easily fail first in large flat areas; failures occur earlier mostly at corners, pipe penetrations, collection ditches, pump pits, anchor trench openings, and slope toe transition zones. The reason is simple: the force there is discontinuous, and the membrane must fit geometric changes while bearing local fixation and backfill disturbance.
For example, at a 90° corner, if no transition fillet is made, the membrane will change direction within a very short distance; the outer side is in tension and the inner side is in compression, resulting in uneven local strain distribution. Additionally, if the weld is too close to the corner or the edge of the additional layer ends too abruptly, cracks often start expanding from the boundary. Many projects require the additional layer at details to exceed the node edge by 150–300 mm, not for aesthetics, but to disperse stress outward.
The following set of comparisons is closer to on-site judgment than a laboratory table:
| Site Condition | Common Size or Range | More Likely Occurrence on Membrane Surface |
|---|---|---|
| Breccia protrusion height | 8–15 mm | Point pressure, indentation, local thinning |
| Substrate coarse particle size | 20–75 mm | Puncture, surface cut |
| Insufficient initial soil cover thickness | <150–300 mm | Insufficient buffering, obvious downward load transmission |
| Long slope surface | 20–60 m | Membrane under tension, weld under shear |
| Small cut length | 2–10 mm | Subsequent easier tear expansion |
| Repeated adjustment near overlap edge | Multiple movements | Scratching, edge opening |
After the substrate and friction, problems around the welds will follow. The weld itself is not necessarily weaker than the parent material, but the weld area undergoes more steps during construction: leveling, overlapping, extrusion, thermal fusion, leak detection, repair, and re-covering. Any hitch in any link will make the area more prone to additional damage. For example, if the overlap surface has sand, debris, or moisture, weld formation will be affected; if the repair location is too close to the original weld bead, it may cause the local membrane body to be repeatedly heated.
A more common problem is not “failing to weld,” but rather the surrounding area being scratched by hard objects after welding, or the overlap edge being locally lifted during backfilling. A 5 mm edge notch might be temporarily fine in a flat area, but if placed near slopes and corners, it could extend to several centimeters after several rounds of stress.
When conducting site inspections, you can prioritize monitoring the following two sets of locations for much higher efficiency:
- Parts more prone to puncture first
- Slope toe and the range of 1–3 m above the slope toe
- The intersection line between the collection ditch bottom and the ditch wall
- The junction of coarse-grained bedding and fine material bedding
- Equipment temporary turning, meeting, and parking areas
- Surroundings of pump pits, maintenance wells, and liquid outlets
- Parts more prone to tear expansion first
- Weld ends and weld intersections
- Pipe penetration roots and near flanges
- Anchor trench edges and backfill transition areas
- Additional layer termination positions
- Locations previously repaired or patched
Shifting the perspective to “how people work,” much damage is unrelated to the material itself but relates to the on-site sequence. When the membrane is just laid, if personnel frequently cross it, tools are temporarily stacked, cables are dragged, welder wheels roll over it, or sandbags are dropped, even if a single impact is small, the cumulative effect is enough to wear scratches into the local surface.
Some projects require the bare membrane exposure time to be controlled as much as possible within the same day or a short window, not because the material cannot hold up, but because the longer it is exposed, the more secondary disturbance occurs. Another common problem is starting to cover before wrinkles are properly handled; after covering, the wrinkles are pressed flat and it looks “fine,” but in reality, extra stretching and wear have been left at the fold line, and if subjected to load later, problems are more likely to appear from the start of the fold line.
Where Exactly Is the Difference?
The difference between reinforced and unreinforced types lies in their inherent structures: reinforced types usually add fabric or a reinforcing skeleton between polymer layers, while unreinforced types are continuous membrane bodies. Once the structure changes, the subsequent stress methods, elongation methods, crack expansion, substrate fitting, welding windows, and detailed handling methods will follow. For products of the same nominal thickness, even if both are labeled 1.5 mm, on-site performance can differ by a whole grade because one is “composite load-bearing” and the other is “continuous membrane body load-bearing.”
Look at the most basic layer first: how the material deforms after being stressed. When tension arises, the dimensional change of the reinforced type is usually smaller, especially during laying, pulling back, slope fixation, and local shearing, as the skeleton limits the membrane body from continuing to elongate.
The unreinforced type has no internal fabric and relies more on the extension of the polymer body itself after being stressed, with local deformation more easily dispersed to surrounding areas. Crossing the same 10–20 mm height difference, the reinforced type is more likely to maintain a “propped up” state, while the unreinforced type is more likely to continue fitting along the substrate contour; the former has short deformation, and the latter has long deformation.
Continuing further, the crack expansion methods are also different. Assuming there is a 5 mm cut on the membrane surface, if tension is subsequently applied, the reinforced type often shows a higher “crack-stopping” capability because the internal reinforcing layer will share part of the stress, making it less easy for the crack to run away in a short time. Crack expansion in the unreinforced type depends more on resin toughness, thickness, temperature, and cut direction.
Under conditions of low temperature, high tension, and a cut perpendicular to the main stretching direction, the crack may extend faster. The most common judgment on the user end is not to see if there is a cut, but to see how many processes and how much time it takes for a cut to go from 5 mm to 20 mm.
Putting the two types of materials into common on-site working conditions makes the differences easier to see:
| Usage Condition | Common Performance of Reinforced Type | Common Performance of Unreinforced Type |
|---|---|---|
| Long side slope laying, length 20–60 m | Dimensional stability, small shrinkage after moving | Easier to fit along the slope, but local stretching is more obvious |
| Substrate has 10–15 mm high points | Easier to form bridging when crossing high points | Easier to fit high points and valleys |
| Stressed after 2–10 mm scratch appears | Crack growth rate is usually slower | Relies more on membrane toughness, growth variance is larger |
| Complex nodes, pipe penetrations, corners | Need more attention to shear and bending radius | Easier to wrap around detailed contours |
| Thermal welding construction | Depends on surface structure and thickness | Welding logic is closer to conventional membrane welding experience |
After looking at the stress methods, look at the differences brought by “needle points” and “corners.” Many people default to thinking reinforced types are more puncture-resistant, but this is not necessarily the case on-site. Puncture first occurs at the surface layer; the surface polymer thickness, hardness, ductility, and point contact area all affect the result. If part of the total thickness of the reinforced type comes from the internal fabric, and the continuous polymer layer available for buffering at the surface is thin, the point load acting on the surface first does not necessarily have more margin than an unreinforced type of the same thickness.
In other words, you cannot just look at “total thickness 1.5 mm”; you must also ask clearly how much thickness the surface layers have respectively, whether it is a single-sided or double-sided protective layer, and where the reinforcing layer is buried.
This point becomes more obvious on coarse-grained substrates. For example, if there are 20–50 mm breccia particles in the substrate with local protrusion heights of 8–12 mm, and equipment organizes the surface after 200–300 mm of soil cover is applied, the load finally transmitted to the membrane surface first contacts that layer of polymer skin. If the skin is first thinned or cut, the reinforcing layer mostly controls the crack rather than replacing the skin to bear all point pressure.
The unreinforced type has no internal skeleton, and the entire thickness participates in pressure bearing and extension; therefore, in some static point pressure scenarios, a thick and uniform continuous membrane body will perform more stably. The user end must distinguish: puncture resistance looks at “which layer the point presses first,” and tear resistance looks at “whether it will continue to run away after there is a wound”; these are not the same issue.
Next, “conformability” must be included in the judgment. One usage advantage of the unreinforced type is its more natural fit to irregular substrates and detailed contours. When encountering small trenches, slope toes, diversion ditch transitions, and pipe wrapping, the continuous membrane body more easily sinks and wraps along the contours, and local bridging cavities will not form so easily.
Because of the internal fabric or skeleton, the bending radius of the reinforced type is usually more restricted; particularly when the temperature is low and the membrane is hard, when encountering corners with very small radii, the outer side will be in tension and the inner side will bunch up, requiring earlier use of additional layers or fillet transitions during installation. For the site, whether it fits is not an aesthetic issue; once bridging forms a 10–30 mm void, the subsequent cover layer will press down, and the edge of the void zone will become a new stress concentration zone.
Hand feel and dimensional control during laying are also different. The reinforced type is more stable during large-scale unfolding, the edges are easier to keep straight, it flutters relatively less when the wind rises, and it is not prone to much secondary shrinkage after being straightened over long distances. For work surfaces where the daily laying area reaches 3000–8000 m², this type of stability affects alignment efficiency.
The unreinforced type is softer and moves more easily with terrain changes, but it is also more prone to wrinkles and ripples, especially during midday high temperatures when the surface temperature rises quickly and length changes caused by thermal expansion are more obvious. It is common on-site to see the membrane laid flat in the morning and wrinkles increasing in the afternoon; when the length is dozens of meters, the resulting slack can reach several centimeters to over ten centimeters, and if not handled promptly, fold lines will be left after covering.
Moving to the construction phase, welding differences cannot be ignored. Since the welding interface of the unreinforced type is “purer,” thermal fusion welding experience is more mature, and many installation teams are more familiar with its temperature, speed, and pressure windows. If the surface structure of the reinforced type is complex or the surface layer is thin, welding relies more on equipment calibration and operational stability; too low a weld temperature may not penetrate, while too high may affect surface integrity.
For users, what matters is not “whether it can be welded,” but whether the weld bead can remain consistent during large-scale construction. For example, for the same batch of materials, the welding window may change significantly between an 8°C morning and a 28°C afternoon; reinforced types are sometimes more sensitive to this because heat must pass through the surface layer before acting on the effective welding interface.
Compressing the judgment into a table will make on-site communication smoother:
| Point of Concern | What to Look at First | Common Tendency |
|---|---|---|
| Expansion after small cut | Whether there is a reinforcing layer to share stress | Reinforced type is often more advantageous |
| Static point indentation | Surface continuous polymer thickness | Depends on structure; cannot just look at total thickness |
| Complex substrate fitting | Bending ability, bridging tendency | Unreinforced type is often more advantageous |
| Long slope positioning stability | Dimensional change, shrinkage | Reinforced type is often more advantageous |
| Large-scale welding consistency | Surface welding window | Unreinforced type is often easier to control |
| Corner and pipe handling | Local wrapping and additional layer requirements | Unreinforced type usually saves steps |
When inquiring with suppliers, it is better not to stop at the level of “is reinforced or unreinforced better.” It is more useful to ask 6 specific things: how much the surface layers account for in the total thickness; the tear expansion performance for cuts of 5 mm and 10 mm; what the recommended minimum bending radius is; which unfolding direction is more suggested when laying on 1V:3H or 1V:4H slopes; roughly what ambient temperature the welding temperature window covers; and whether detailed nodes require the additional layer to exceed the edge by 150 mm or 300 mm. Only by asking these steps do the differences truly fall to the usage level.
How to Bring Down the Damage Rate
In mining projects, the geomembrane damage rate is rarely determined by the material itself alone; it occurs more where “substrate, protective layer, laying sequence, equipment routes, and detailed practices” overlap. If the damage control target is written as checkable numbers on-site, execution will be much more stable. For example, change “clear away obvious sharp stones” to “no hard protrusions higher than 10 mm above the surroundings are allowed on the substrate surface,” change “cover as soon as possible” to “bare membrane exposure time should be controlled within the same day’s shift as much as possible,” and change “do a good job of protection” to “initial soil cover thickness not less than 150–300 mm before allowing light equipment to enter.”
The first step is not to switch to a thicker membrane but to refine the substrate and transition layers. Many punctures start from substrate high points; even if the membrane thickness reaches 1.5 mm or 2.0 mm, if 20–75 mm breccia, concrete fragments, rebar ends, or hard ridges are left underneath, indentations and local thinning will still occur. Do not just look at “flatness” during substrate acceptance; also look at “hardness, sharpness, and continuity of support.”
It is recommended to separately re-inspect slope toes, anchor trenches, trench corners, and collection ditch bottoms because 5–15 mm protrusions and sudden geometric changes are most likely to appear there; once the membrane is laid, short-distance bridging will form, and subsequent pressure will concentrate strain at the edges.
Listing the most easily missed control points at the front end will make execution smoother:
- Substrate Treatment
- Remove protruding sharp stones and hard fragments with a particle size over 20 mm.
- Repair local high points when they are about 10 mm higher than the surroundings.
- Separately verify slope toes, ditch bottoms, and anchor trench edges rather than passing them over with the main area.
- If desiccation crack width reaches 5–20 mm, backfill with fine material before laying the membrane.
- Add a layer of transition fine material to coarse particle areas first; do not let the membrane rest on sharp edges.
- Transition and Buffering
- When the substrate surface is too coarse, increase the fine material layer or protective geotextile.
- Protective geotextile weights are commonly chosen from 300 gsm, 400 gsm, 600 gsm and up.
- Do not have “hard on hard” contact between the coarse particle cover layer and the membrane; leave a buffer layer in between.
- Try to make smooth transitions for slope changes; do not leave small-radius angles.
- Reserve an additional layer range around pipe penetrations, pump pits, and flanges, commonly extending 150–300 mm.
After substrate treatment, the second step is to match the protective layer to the working conditions, not to habit. A very common situation on-site is: the drawings specify protective geotextile but do not specify weight, compressed thickness, or overlap method, resulting in materials that can only block fine sand but not 15–40 mm gravel. For the user, it is not enough for a protective layer to “be there”; you must see if it can still retain buffering after being compressed.
For example, with 200 mm of soil cover and 30–60 kPa level equipment ground pressure, a protective layer that is too thin will be compressed and quickly lose elasticity, and point loads will still be transmitted to the membrane surface. The protective layer must also be continuous, with overlap seams staggered and fixed in place; otherwise, if local displacement occurs, the membrane will be exposed to the rough surface.
Next, the laying sequence and equipment routes must be fixed. Much damage is not generated the moment the membrane is laid but is “added” repeatedly by subsequent processes. The longer the bare membrane is exposed, the higher the probability of cable dragging, tool stacking, sandbag dropping, and frequent personnel trampling. During large-scale construction, it is not uncommon to lay 3000–8000 m² in a single day; if only 1%–3% of the area is dragged a second time, the cumulative scratch length is considerable.
A safer practice is to make laying, welding, testing, and covering as continuous as possible, not allowing the same piece of membrane to enter and exit the construction area repeatedly. Equipment routes should also be determined early; even for light machinery, do not let it roll back and forth in areas with insufficient initial soil cover.
This part is more suitable to be written as operational constraints that on-site personnel can execute at a glance:
- Laying and Exposure Control
- Try not to leave the bare membrane exposed across multiple shifts.
- Complete positioning, welding, testing, and covering as soon as possible after unfolding.
- Do not leave wrinkles to be handled before covering; fold lines will form local wear zones.
- Keep the number of times rolls are adjusted as low as possible to reduce long-distance dragging.
- Do not leave welders, cables, or clamps on the membrane surface for long periods.
- Equipment and Personnel Routes
- Do not arrange for equipment to enter until the initial soil cover reaches 150–300 mm.
- Fix temporary channels and do not let equipment change lines temporarily.
- Keep turning, U-turn, and parking areas away from slope toes, ditch bottoms, and dense weld areas.
- Place tools and accessories centrally; do not stack them randomly on the membrane surface.
- When personnel cross detailed nodes, do not step on pipe mouths, patches, or weld ends.
With the substrate and processes controlled, the third step is the turn for detailed practices. Main areas are usually safer than details; problems often occur earlier at pipe penetrations, collection ditch corners, pump pits, anchor trench openings, slope toes, and weld intersections. The reason is not complex: those places simultaneously have geometric changes, local fixation, backfill disturbance, and hydraulic or load changes.
For example, at the root of a pipe penetration, the membrane must both wrap the circular pipe and bear the surrounding backfill compaction; if no additional layer is made, or the edge of the additional layer ends too close, the edge will become a location of sudden stress change. Another example is weld intersection areas, where materials have undergone multiple heatings and overlaps; if subjected to point pressure or friction later, damage is more likely to start from the edge.
For details, it is better to draw the practices more finely than to leave them to on-site “improvisation.” The following set of locations is most worth adding layers or changing practices in advance:
- High-Risk Detailed Parts
- Around pipe penetrations, flanges, and valve bases.
- The four corners and bottom transition lines of pump pits.
- The junction line between the collection ditch bottom and side walls.
- Anchor trench edges and slope toe transition zones.
- Weld ends, weld intersections, and repair locations.
- Densely patched areas and areas with existing indentations.
- Common Reinforcement Methods
- Add additional membrane sheets, extending the margin outward by 150–300 mm.
- Locally add protective geotextile or buffer bedding.
- Change sharp corners to rounded transition fillets.
- Use prefabricated kits or multi-layer closures at pipe penetration locations.
- Level slope toes and ditch bottoms first before adding local layers.
Besides processes and details, the detection method also affects the damage rate because many problems can still be fixed before covering. If only weld leak detection is done on-site without looking at surface indentations, scratches, whitening, and small cuts, the number of subsequent repairs will usually be high. A more practical inspection is not just asking “does it leak,” but also counting “is there much damage and where is it concentrated.”
For example, count the number of indentations, surface scratch lengths, number of patches, and repair point distribution once every 1000 m², and then mark the data back onto the floor plan; if patches are particularly numerous next to a certain equipment route, the problem is likely not with the material but with the channel or soil covering sequence. For slope surfaces, also look for slip marks and stretching marks on both sides of the weld, because once cover material slowly slides down, it will continue to transmit force to the membrane and welds.
Making inspections a fixed action will lead to much less controversy on-site:
| Inspection Item | Suggested Observation Timing | More Common Problems |
|---|---|---|
| Substrate high points and hard protrusions | Before laying membrane | Point pressure, bridging, later puncture |
| Surface scratches and whitening | After laying, before covering | Subsequent crack expansion |
| Weld edge status | After welding, before soil cover | Edge opening, excessive repairs |
| Detailed additional layer margins | After node completion | Stress concentration, local edge lifting |
| Initial soil cover thickness | Before equipment enters | Insufficient buffering, indentation through layer |
| Patch density | Statistical count by zone | Problems with construction route or local process |
In many projects, obvious problems are not seen on the day of laying, but emerge in the same batch of locations after 7 days, 30 days, or 90 days. Reasons include cover layer settlement, day-night temperature differences, liquid level fluctuations, and local support changes. When surface temperature rises during the day, the membrane will expand and wrinkle; after the temperature drops at night, the wrinkles fall back, but the fold line position has already experienced repeated bending.
If the slope length reaches 20–60 m and the cover layer has a certain sliding tendency, tension is more likely to accumulate slowly near the weld ends and slope toes. Regular inspections should not just look for leaks but also check if indentations are getting deeper, if edges around patches are reopening, and if there are new whitening zones on both sides of the welds.
Elongation and Settlement
In mining seepage control systems, whether a material can deform along with the foundation often affects the usage result more than nominal strength. The elongation at break of unreinforced geomembranes is commonly 500%–800%, while many reinforced products only have 10%–30%, although they have higher tensile strength.
When uneven settlement of 25–100 mm, slope displacement, or local voids occur in the foundation, low-elongation materials are more likely to concentrate strain at welds, corners, and anchor zones. Therefore, selection cannot just look at strength; it must also look at settlement tolerance, strain distribution, and the flatness of the construction surface.
How Large is the Settlement
Foundations in mining containment areas rarely stay stationary for long. Heap leach pads, tailings facilities, evaporation ponds, and process ponds often experience consolidation, redistribution of additional loads, and continued sinking of local weak zones within the first 3–18 months of operation. For geomembranes, the issue is not whether the foundation will settle, but whether the settlement amount is 10 mm, 30 mm, or 80 mm, and whether the settlement range is continuously distributed or concentrated within a short distance of 1–3 m. The former can mostly be absorbed by membrane surface conformance and protective layer buffering, while the latter is more likely to concentrate tension near toe of slopes, welds, penetration structures, and anchor trenches.
From field performance, settlement usually does not appear uniformly. In a containment unit with an area of 20,000–100,000 m², the center of the platform may only have 15–25 mm of uniform sinking, while the transition zone between the slope and the platform might show a height difference of 20–50 mm within a horizontal distance of 5 m. If only the total settlement is considered, it is easy to underestimate local membrane strain.
The geomembrane does not stretch evenly across the entire pond bottom; instead, it consumes displacement along the shortest path. The more concentrated the height difference, the higher the strain per unit length.
Looking further down, there are at least 3 common distribution patterns for settlement. The first is large-scale uniform consolidation, common in compacted fill areas, with values mostly between 10–40 mm; the second is differential settlement, common at the interface of old and new fill or areas with inconsistent backfill density, where local height differences can reach 20–60 mm; the third is point or strip-like settlement, common above weak interlayers, unremoved boulders, or local backfill voids, where the influence range is sometimes only 0.5–2.0 m, but the tension borne by the membrane will be more concentrated.
Placing the problem within the membrane installation structure makes it easier to judge risk locations. Stress in the middle of the platform is relatively dispersed, and the geomembrane can adjust along with the protective layer through slight ripples. The toe of slopes, collection sumps, pipe penetrations, and anchor trench transition zones are different; these areas already have geometric transitions, increased weld density, and local constraints. Once settlement is superimposed, the material does not have much space to redistribute strain.
For example, if a 30 mm differential settlement occurs near the toe of a slope with an influence length of only 2 m, the average apparent deformation gradient is 1.5%; if factors like flattened wrinkles, local stone protrusion, or overly stiff welds are superimposed, the actual peak strain is often higher than the apparent value.
The following locations should be prioritized during field spot checks, rather than just focusing on large center areas:
| Location | Common Settlement/Displacement Magnitude | Typical Influence Length | Membrane Surface Performance |
|---|---|---|---|
| Center of Platform | 10–30 mm | 10–50 m | Mainly conforming, small local ripples |
| Slope Toe Transition Zone | 20–50 mm | 1–5 m | Wrinkles pull straight before taking tension |
| Around Collection Sumps | 15–40 mm | 1–3 m | More sensitive near welds |
| Pipe Outlets, Penetration Structures | 5–25 mm | 0.5–2 m | Local tightening, uneven deformation |
| Anchor Trench Backfill Area | 15–35 mm | 1–4 m | Reduced margin after membrane is fixed |
| Above Weak Soil Strips | 25–100 mm | 1–6 m | Concentrated stretching, may accompany bridging |
Settlement is also affected by time and is not completed all at once. Within the first 30–90 days of operation, many areas show rapid consolidation; thereafter, they enter a period of 6–24 months of slow continued settlement. For management, phased changes are more indicative than a single measurement. Detecting a 12 mm settlement the first time does not mean it won’t grow to 35 mm later.
If only one layer of protection is laid in the early stage, and subsequent increases in stacking load, liquid level, or soil cover occur, the foundation stress conditions will change, and originally mild areas may turn into differential settlement zones during subsequent operation.
Inhomogeneity formed during construction also amplifies the problem. If the compaction degree of the base surface differs by 3%–5% in adjacent areas, the backfill material grading is inconsistent, or a section of protective layer thickness changes from 300 mm to 150 mm, the support conditions borne by the membrane will be significantly different. What is seen on site is often just that “the surface looks similar,” but what the geomembrane feels is different support stiffness below and different load distribution above. The greater the change in foundation modulus, the easier it is for the settlement position to be fixed in a specific strip rather than spreading randomly.
When temperature and settlement are superimposed, the problem becomes more apparent. The surface temperature of black HDPE geomembrane under sunlight can be 20–35°C higher than the ambient temperature; the membrane surface expands to form wrinkles at noon and retracts at night. If welded and fixed during the day and retracted at night, and then encountering local settlement, part of the displacement that should have been absorbed by wrinkles will turn into tensile strain.
For example, a 15 m long section of membrane forms a cumulative 80 mm wrinkle margin at high temperatures. After cooling down at night, 40–60 mm has already been consumed. If a further 20–30 mm settlement occurs, the actual available deformation margin is much smaller than what is judged by the naked eye.
From a management perspective, settlement monitoring should not just leave a total figure. A more useful recording method is “Location + Value + Time.” For example: East side of slope toe K1+240 to K1+260, cumulative settlement 28 mm within 60 days; 3 m radius area south of the collection sump, height difference 18 mm within 90 days; 20 m × 30 m area in the northwest corner of the platform, uniform settlement 14 mm within 6 months.
With locations and variation intervals, one knows which section of weld, which section of protective layer, and which penetration structure to check during the next inspection, rather than average sampling over the entire area.
On-site risk of settlement can usually be divided into the following 4 levels to facilitate scheduling inspection frequency:
- Low Level: Uniform settlement <15 mm, influence length >10 m
- Medium Level: Differential settlement 15–30 mm, influence length 3–10 m
- High Level: Differential settlement 30–50 mm, influence length 1–3 m
- Very High Level: Local settlement >50 mm, influence length <3 m
This type of classification is more suitable for field use than “settlement/no settlement” because a 30 mm displacement distributed over a 20 m length versus a 1.5 m length puts the membrane in completely different states. The former is mostly slow deformation, while the latter is closer to local tightening.
Looking at several easily overlooked locations: the interface between old and new construction areas is most common, as the age, moisture status, and compaction passes of the fill on both sides are often different; strip-like settlement also frequently occurs above backfilled trenches, with widths possibly only 0.8–1.5 m; after temporary roads for frequent vehicle traffic are converted to permanent containment areas, there may be harder compaction zones underneath, forming a stiffness differential with the surroundings. After the membrane is laid, the surface looks level, but six months later, differential settlement begins to appear along the boundaries, with anomalies often appearing first within 1–2 m on either side of the boundary.
Deformation Differences
When mining geomembranes are placed on site, they do not bear tensile force from a single direction. They must simultaneously face base surface ripples, local settlement, thermal contraction, protective layer surcharge, slope down-drag friction, and weld constraints. If only tensile strength is considered, it is easy to miss a more common occurrence: the material is distributing displacement within the 2% strain, 10% strain, or 200% strain range. The difference between reinforced and unreinforced types is reflected first in the deformation path and then in the final failure values.
Looking first at common data ranges: the elongation at break for unreinforced HDPE geomembranes is commonly 500%–800%, and the yield elongation is commonly about 10%–20%; LLDPE is often even higher, with some products reaching over 700% elongation at break. For reinforced products, because they contain internal fabric, mesh, or composite skeletons, the nominal tensile strength increases, but the elongation at break for many products is only 10%–30%. Although some composite membranes can achieve higher total elongation, in actual engineering, the effective deformation available to digest non-uniform settlement is still limited by the reinforcement layer.
When placing these two types of materials on the same foundation, the difference becomes more pronounced. Suppose a section of membrane spans a 3 m long slightly soft zone with a center sinking of 30 mm. Unreinforced membranes usually disperse strain through more continuous in-plane elongation and local conformance; reinforced materials are more likely to limit displacement within a shorter interval, causing strain peaks to be near the boundaries of the soft zone, welds, or anchor ends.
The result seen on site is not necessarily an immediate rupture of the membrane, but more often the appearance of membrane tightening, disappearance of wrinkles, and local bridging, after which welds or penetration nodes begin to become sensitive.
The stress-strain curves of the materials are also different. Unreinforced polyethylene membranes usually have a distinct yield stage, after which they can continue to undergo large plastic deformation. Reinforced materials often exhibit higher stiffness at lower strain levels, with a steeper initial curve and slower elongation growth. For slope construction, this initial stiffness is beneficial for controlling dimensional changes; for non-uniform settlement, it causes the material to “transmit” displacement back earlier.
When seeing “high modulus, high strength” in design documents, it is best to simultaneously look at the tensile data at 2% and 5% strain, because many field deformations do not wait until the material is near break to produce an impact.
The following comparison is closer to the field user experience:
| Metric | Unreinforced Geomembrane | Reinforced Geomembrane |
|---|---|---|
| Elongation at Break | Commonly 500%–800% | Commonly 10%–30% |
| Stiffness at 2% Strain | Low to Medium | High |
| Conformance to Base Ripples | Good | Weak |
| Slope Dimensional Stability | Average | Good |
| Remaining Margin After Wrinkle Flattening | Large | Small |
| Strain Dispersion Under Local Settlement | Good | Weak |
| Probability of Strain Concentration Near Welds | Medium | High |
How a material deforms also interacts with its thickness. Common mining HDPE membrane thicknesses are about 1.5 mm, 2.0 mm, 2.5 mm. Increasing thickness improves puncture and some tensile properties, but also reduces flexibility. A common phenomenon in the field: with the same 2.0 mm thickness, unreinforced membranes are more likely to “stick” to the surface of a fine-grained base; under the same conditions, reinforced membranes are more likely to maintain a bridging state.
Once the bridge length reaches 100–300 mm and the overlying protective layer presses down, local contact stress will rise, and the membrane stress will no longer be smoothly distributed.
Looking at the problem on slopes: common slope ratios for mining heap leach pads are 3H:1V, 2.5H:1V, and sometimes steeper. Reinforced membranes are more dimensionally stable on slopes, less likely to be elongated by their own weight during installation, and better able to resist dragging caused by overlying geotextiles, drainage nets, and protective layer construction. Unreinforced membranes are more prone to thermal expansion wrinkles and downward sliding on long slopes, requiring more detailed installation management.
If facing a 30–60 m long slope, heavy overlying layers, and a short construction window, reinforced materials will save construction control costs in such conditions, provided that settlement at the toe and transition zone has been controlled within a small range.
This often leads to a common misjudgment: since reinforced membranes perform more stably on slopes, the same material logic is applied to the entire area. The problem is that the deformation modes for slopes and pond bottoms are different. Slopes are more biased toward in-plane tension, frictional drag, and positioning stability; pond bottoms more commonly involve settlement, local ripples, and load transfer from the protective layer. If only one set of strength values is looked at for the entire site, regional differences are easily ignored.
Chemical Resistance
In mining liner selection, Chemical Resistance starts with one thing: what liquid will the liner contact, for how long, and at what temperature. Using common heap leach and tailings conditions as examples, liquid pH may be below 2, salt concentration can reach tens of thousands of mg/L, and the design service life is typically 20–30 years.
What Media are Involved
Mineral processing, heap leaching, tailings return water, and process waste liquids—though the names differ, the chemical environments the liners face vary significantly. When reviewing a liner’s Chemical Resistance, the first step is not to look for “acid resistant” or “chemical resistant” on a product page, but to clearly define the site fluids: is the pH 1.8 or 11.5? Is the liquid temperature 25°C or 45°C? Is the liquid static year-round or circulating for 16 hours a day?
In a sulfuric acid system, 2 g/L of iron versus 25 g/L of iron leads to entirely different material aging paths. Similarly, for high-salinity brine, a TDS of 18,000 mg/L versus 110,000 mg/L results in different osmotic pressures and diffusion states.
Many project documents simply state “acidic solution” or “process water,” which is of little help for liner selection. A more useful engineering approach is to break the media down into measurable, comparable figures: acidity/alkalinity, temperature, ionic composition, redox environment, solid content, and contact cycle.
For example, in metal leachates, common components are not just acids; sulfate, chloride, Fe³⁺, Cu²⁺, Zn²⁺, Al³⁺ often appear simultaneously. Evaporation pond liquids might reach 42°C during the day and drop to 17°C at night, completing a full thermal cycle within 24 hours. Tailings supernatant may also carry 0.5%–3% suspended fine particles, constantly abrading the membrane surface.
Only by classifying the liquid first can you know which compatibility data to consult. In low-pH environments, the focus is usually on the acid’s impact on the membrane body; in high-salinity environments, beyond chemical contact, one must examine dimensional changes and flexibility retention after long-term immersion. When oxidants are present, the consumption rate of the material surface and antioxidant system must be checked separately. If the site liquid simultaneously contains pH 2.0, 35°C, 35,000 mg/L sulfate, 4,000 mg/L chloride, and 8 g/L Fe, an old sample of “acid immersion at room temperature for 30 days” cannot substitute for a real judgment.
The most easily overlooked factor is that the medium is not a fixed recipe. After a mine begins operation, liquid composition changes with the season, return water ratio, ore grade, and added reagents. A heap leach pad might have acid at pH 1.5–2.0 during the startup phase, but as it enters the stable phase, copper, iron, and aluminum ion concentrations gradually rise, liquid conductivity increases, and local temperatures may exceed design values by 5°C–10°C.
After concentration in an evaporation pond during the dry season, TDS might rise from 25,000 mg/L to over 80,000 mg/L, and the chloride ratio will also shift. What is needed is not “is this membrane acid-resistant?” but “how much performance can this membrane retain in the liquid after its composition changes?”
You can first organize the site media into a minimum information package for suppliers and laboratories:
- pH Range: e.g., 1.6–2.4 or 10.8–11.7
- Liquid Temperature Range: e.g., 22°C–38°C, peak 45°C
- Primary Ions: e.g., SO4²⁻ 28 g/L, Cl⁻ 3.5 g/L, Fe 6 g/L, Cu 2 g/L
- TDS: e.g., 42,000 mg/L
- Suspended Solids: e.g., 1.2 wt%
- Contact Method: Continuous immersion, gas-liquid alternation, emptied once per week
- Service Life: 15 years, 20 years, 30 years
- Operational Fluctuations: Wet season dilution, dry season concentration, diurnal temperature difference of 15°C
The closer the data is to the field, the more useful the subsequent material testing. If a supplier only provides a table stating “resistant to most acids and alkalis” without concentration, temperature, or immersion duration, further inquiry is required. Simply stating “sulfuric acid compatible” is insufficient, as 5% H2SO4 and acidic process fluids containing multiple metal salts are not the same contact condition. The latter involves metal ions, salt loads, oxidative states, and longer contact times in addition to the acid.
To ensure a stable judgment, it is usually necessary to distinguish between three types of working conditions, as they impose different requirements on the liner:
- Long-term Static Storage: Liquids stay for a long time; contact duration is measured in years.
- Continuous Circulating Process Fluids: Liquids flow for 8–24 hours daily; temperatures are less stable.
- Concentration-type Ponds: Salinity continuously rises after evaporation; late-stage concentrations can reach 2–4 times the initial levels.
Long-term static storage focuses more on retention rates after immersion; continuous circulating process fluids require checking thermal cycles; concentration ponds necessitate checking late-stage high-salinity samples rather than just startup phase liquids. If testing is only done once using liquid from the start-up phase, the data’s relevance will significantly decline by the 3rd or 5th year of operation.
Even with the same medium name, the underlying chemical conditions can vary greatly. Taking “pregnant leach solution” as an example, across different projects, pH may differ by 0.8–1.5 units, copper ions from 0.5 g/L to 6 g/L, iron content from 1 g/L to 20 g/L, and chloride from a few hundred mg/L to tens of thousands mg/L. Combined with environmental temperature differences, the actual contact conditions for the liner are on completely different levels. Project-specific process fluid data is required, not industry averages.
Once the media details are broken down, selection becomes much smoother. Usually, three sets of parameters can be cross-checked before applying material tests:
| Parameter | Common Range | Issues to Consider |
|---|---|---|
| pH | 1–13 | Low pH or high pH; long-term stability |
| Temperature | 20–60°C | Whether peak values exceed standard experimental temperatures |
| TDS | 5,000–100,000+ mg/L | Whether salinity will continue to rise later |
| Chloride | 200–20,000+ mg/L | Existence of high-chloride concentration environments |
| Sulfate | 1–50 g/L | Coexistence with high metal ions |
| Metal Ions | 0.1–25 g/L | Whether Fe, Cu, Zn, Al are high |
| Suspended Solids | 0–5 wt% | Accompanied by abrasive effects |
The presence of oxidants in the media should also be listed separately. Some process fluids come into contact with components like ferric iron, peroxide, or hypochlorite; even at low concentrations, their impact on the material surface and weld retention after long-term contact must be checked independently. Focusing only on “acid-base resistance” is insufficient, as test results from oxidative environments and purely acidic environments are often not interchangeable. A sample stable at pH 2.0 may show a different trend in retention data when placed in a liquid containing oxidative components.
Chemical Performance
Many people looking at mining liner data first focus on the outermost material name, such as HDPE, LLDPE, or fPP, and stop their Chemical Resistance judgment at the resin type. This is not enough. For reinforced liners, liquid contact indeed first hits the surface, but during long-term service, material performance is also affected by thickness distribution, reinforcement material, interlaminar bonding, weld zone heat influence, and accessory compatibility.
A product with HDPE on the surface cannot be judged by the same logic as a solid 1.5 mm non-reinforced single-layer HDPE if it only has an effective 0.25–0.40 mm coverage layer while the total thickness reaches 1.0–1.5 mm.
Look at the structural path first. Process fluids do not stop affecting the membrane once they “hit the surface”; they act on multiple parts of the membrane body over time, temperature, and stress states. For single-layer non-reinforced membranes, the path is usually “surface—body—weld.” For reinforced composite membranes, the path often becomes “surface—cover layer—interlaminar interface—reinforcement skeleton—opposite interface—welds and joints.” As the path lengthens, variables increase.
If the site liquid temperature remains at 35–45°C for 5–20 years of immersion, the statement “outer layer chemically resistant” alone is unacceptable.
Some reinforced product specifications highlight high tensile strength, such as 20–40 kN/m, or higher dimensional stability, but that is mechanical information and does not equate to the stability of the entire system after long-term chemical contact. One must ask: what is the surface resin, what is the surface thickness, is the reinforcement layer polyester, glass fiber, scrim, or another material, and is the interlaminar bond formed via extrusion coating, thermal lamination, or adhesive bonding?
A simplified table can be used to determine additional check items when “resins are identical but structures differ”:
| Structure Type | Primary Material Name | Layer Details to Inquire | Data to Review After Long-term Contact |
|---|---|---|---|
| Single-layer Non-reinforced | HDPE / LLDPE | Thickness, OIT, Welds | Tensile retention, Elongation retention, Stress cracking |
| Three-layer Co-extruded | HDPE | Thickness ratio of each layer | Are surface/core formulas identical; change after heat aging |
| Reinforced Geomembrane | HDPE / fPP / PVC | Cover thickness, reinforcement grid, interlaminar bond | Peel strength, interface stability, reinforcement integrity |
| Coated Composite | Polymer-coated fabric | Coating thickness, base fabric material | Coating cracking, pinholes, edge protection, interface durability |
Cover layer thickness is often ignored. The same HDPE resin label does not mean two products have the same margin in chemical environments. For example, a composite membrane with 0.30 mm on both top and bottom surfaces and a reinforcement layer in between, versus a non-reinforced membrane with a total thickness of 1.5 mm of continuous polymer. Both might “pass” short-term chemical contact, but after 180 days, 1 year, or longer, and at temperatures up to 50°C, the interpretation of long-term retention will differ.
Looking deeper, the material of the reinforcement layer itself changes the judgment. If the skeleton is polyester scrim, one must verify if the polyester is stable in the target medium and temperature, in addition to the surface resin. If it is glass fiber, the long-term state of the fiber-resin interface must be confirmed. If it is woven fabric, the behavior of yarns, coatings, and interlacing points after repeated bending must be examined.
Many project fluids are not just single acids or salts but pH 1.5–3.0 acidic systems with 5–20 g/L metal ions and 30,000–80,000 mg/L dissolved salts; one cannot default to assuming the internal skeleton “doesn’t need to be checked because it’s not in contact.”
If a supplier only submits a chemical compatibility table for the surface resin without immersion data for the entire composite membrane in the target medium, the documentation is incomplete.
Interlaminar bonding is another easily skipped area. Layers of reinforced membranes are usually connected by thermal lamination, extrusion lamination, calendering, or coating. After long-term liquid contact on site, what matters is not “how high the peel strength was at the factory” but how much peel strength remains after immersion. If a sample has an original peel strength of 3.0 N/mm but drops to 1.2 N/mm after 90 days in the target medium, with visual signs of local whitening or edge curling, this information is far more valuable than the phrase “excellent chemical resistance.”
“Doesn’t the liquid only touch the outermost layer?” Sites are not always ideal planes. Anchor trenches, weld overlaps, T-joints, patch edges, pipe penetrations, and vertical corners all complicate surface thickness distribution and heat-affected zones. Dual-track hot-wedge welding significantly raises local temperatures during construction; the material near the weld has undergone an extra thermal history. If liquid temperatures remain around 40°C long-term, the aging pace of the weld zone and the parent material may not be synchronized.
The following points are suitable for checking one by one during document review—brief, but they pull the issue down to the structural level:
- Is the surface thickness 0.25 mm, 0.40 mm, or higher?
- Is the reinforcement material explicitly stated?
- Are the cover layer and reinforcement layer laminated by the same manufacturer?
- Is there peel strength data after immersion for at least 90–180 days?
- Have weld samples also undergone immersion in the same medium?
- Do detail patch areas use materials from the same system?
- Is the interface still stable after edge cuts are exposed?
Surface resin stability does not guarantee the stability of welds, edges, interfaces, and accessories. In mining ponds, failures often occur not in large flat areas but where stress, temperature, and geometry changes are concentrated. A composite membrane that seems to have “excellent parent material performance” may fail if accessories near pipe penetrations use different formulas or transitional components with adhesive; after long-term contact with pH 2.0, 35°C, high-sulfate liquids, the transitional parts may change first rather than the main membrane.
If the project medium is simple, the temperature low, and the service years short, surface resin information is highly relevant; however, mining scenarios commonly involve low pH, high salt, metal ions, thermal cycles, and local stress existing simultaneously.
Verification Methods
Chemical Resistance cannot rely solely on a few lines in a product description. What can actually be used for judgment is a set of data matching the site conditions: parent material, entire membrane, welds, details, long-term immersion, temperature changes, and media changes. In mining projects, design lives are often 15–30 years, liquid temperatures fluctuate between 20–45°C, and local areas of some evaporation or process ponds can exceed 50°C. If verification methods stop at “room temperature, short-term, single specimen,” the data’s reference value is very limited.
Look at the test object first. Many documents test resin sheets, not the finished membrane; some test parent material but not welds; others test the whole membrane but exclude details like pipe penetrations, patches, and T-joints. It is necessary to clarify “what was tested.” For single-layer non-reinforced membranes, at least two sets of data (parent material and welds) are needed; reinforced liners require additional interlaminar or peel data after the entire membrane is immersed.
If a report simply states “sample immersed for 30 days” without specifying whether the sample was a 2 mm smooth sheet, a welded specimen, or a composite structure with reinforcement, the conclusions should be viewed with caution.
Similarly, check if the test medium is close to the site conditions. One project’s process fluid might be pH 1.7–2.3, 35°C, 28 g/L sulfate, 4 g/L chloride, and 6 g/L iron; another might be high-salinity brine with TDS reaching 70,000–110,000 mg/L. If a supplier only provides “5% sulfuric acid at 23°C for 28 days,” that is only a starting point, insufficient to cover real conditions. The presence of metal ions, oxidative components, suspended solids, and diurnal thermal cycles in the medium will all affect verification results.
To avoid looking only at original strength, focus on the following verification objects:
- Parent Material: Thickness, tensile, elongation, tear, puncture.
- Whole Membrane: Mass change, dimensional change, visual change after immersion.
- Welds: Shear, peel, retention after immersion.
- Reinforced Structure: Interlaminar bond, peel strength, interface appearance.
- Details: Patches, pipe penetrations, edge cuts, T-joints.
- Long-term Aging: OIT, HP-OIT, performance retention after heat aging.
Test duration should not just be a single number. Many documents habitually provide 30-day data, but mining ponds are not 30-day operations. A more practical approach requires at least three time points: 30 / 90 / 180 days, with temperatures preferably covering site averages and peak values.
If site liquid temperatures are commonly 32–38°C but can hit 45°C in summer, verification should not be set only at room temperature (23°C). The difference in immersion results for the same material at 23°C versus 50°C can be significant, especially regarding elongation retention, interface changes, and weld stability.
Simply checking “pass/fail” is not enough. Original values and post-immersion values are needed to judge how much performance was retained. For instance, an original break elongation of 700% dropping to 540% after 90 days has a different impact on site tolerance than one that remains at 650%. If original weld shear strength is 85% of the parent material and drops to 68% after immersion, the welding process, heat-affected zone, and potential edge geometric stress concentration must be further checked.
The table below is suitable for quick screening during document review:
| Verification Item | What to See in the Report | How to Interpret |
|---|---|---|
| Immersion Medium | pH, ionic composition, concentration, temperature | Cannot just be “acid solution” |
| Duration | 30 / 90 / 180 days or longer | 7 or 14 days is insufficient |
| Specimen Type | Parent material, whole membrane, weld, composite layers | Different objects cannot be conflated |
| Output Format | Original value + Post-immersion value + Retention rate | Pass/fail alone is insufficient |
| Visual Record | Blistering, whitening, hardening, delamination, cracking | Visual changes cannot be ignored |
| Structural Data | Peel strength, interface state | Mandatory for reinforced products |
Report formatting also affects judgment. The most reliable reports separate data for each time point (e.g., 30, 90, 180 days) and note test temperature, specimen ID, thickness, medium formula, and whether the immersion liquid was replaced. If the test cycle lasts 180 days, one must check if liquid was replenished, pH maintained, and evaporation controlled. For high-salinity samples, evaporation changes concentration; for acidic samples, without pH monitoring, the liquid state at the end of the test may have deviated from initial conditions.
Some projects are better suited for parallel verification across multiple groups rather than a single liquid. For example, in an evaporation pond project, TDS at startup might be 25,000 mg/L but rise to 80,000 mg/L after 12–18 months; temperature differences between wet and dry seasons at the same location can reach 10–15°C. In such cases, it is best to prepare at least two or three representative media: standard operational liquid, high-salinity concentrate, and high-temperature samples.
The following two sets of questions help verify if experimental design is sufficiently detailed:
- Does test temperature cover 23°C, 40°C, and 50°C?
- Does the medium use actual site liquid samples or a close simulant?
- Is the liquid replaced during immersion, and at what frequency?
- Are pH drift, conductivity changes, and concentration changes recorded?
- Are there parallel samples, and is the quantity 3 or more?
- Are weld specimens and detail specimens included?
Reviewing the output results:
- Are original values, averages, and standard deviations provided?
- Is the retention rate explicitly stated rather than just absolute values?
- Are photos attached showing whitening, blistering, or edge changes?
- Are before-and-after peel comparisons provided for reinforced products?
- Are shear and peel results provided separately for welds?
- Are post-test failure modes explained?
Verification of details is often overly compressed. While large flat areas of site ponds are relatively straightforward, changes are more likely at vertical-to-floor transitions, anchor trench turns, pipe penetrations, pump bases, drainage ditches, T-joints, and patch overlaps. Detail areas are geometrically more complex, have higher local stress concentrations, and higher weld density. If liquid temperatures are consistently 35–40°C with 10,000 mg/L chloride or high-concentration sulfates, immersion data for representative weld and patch specimens should be requested.
Finally, check if the data aligns with design assumptions. If the design specifies 2.0 mm smooth HDPE but the report uses a 1.0 mm specimen; if design conditions state 45°C but the report only covers 23°C; or if site liquid contains multiple metal ions but the report only tests pure acid—these three discrepancies are enough to distort the conclusion.


Leave a reply