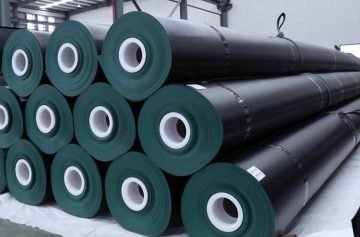
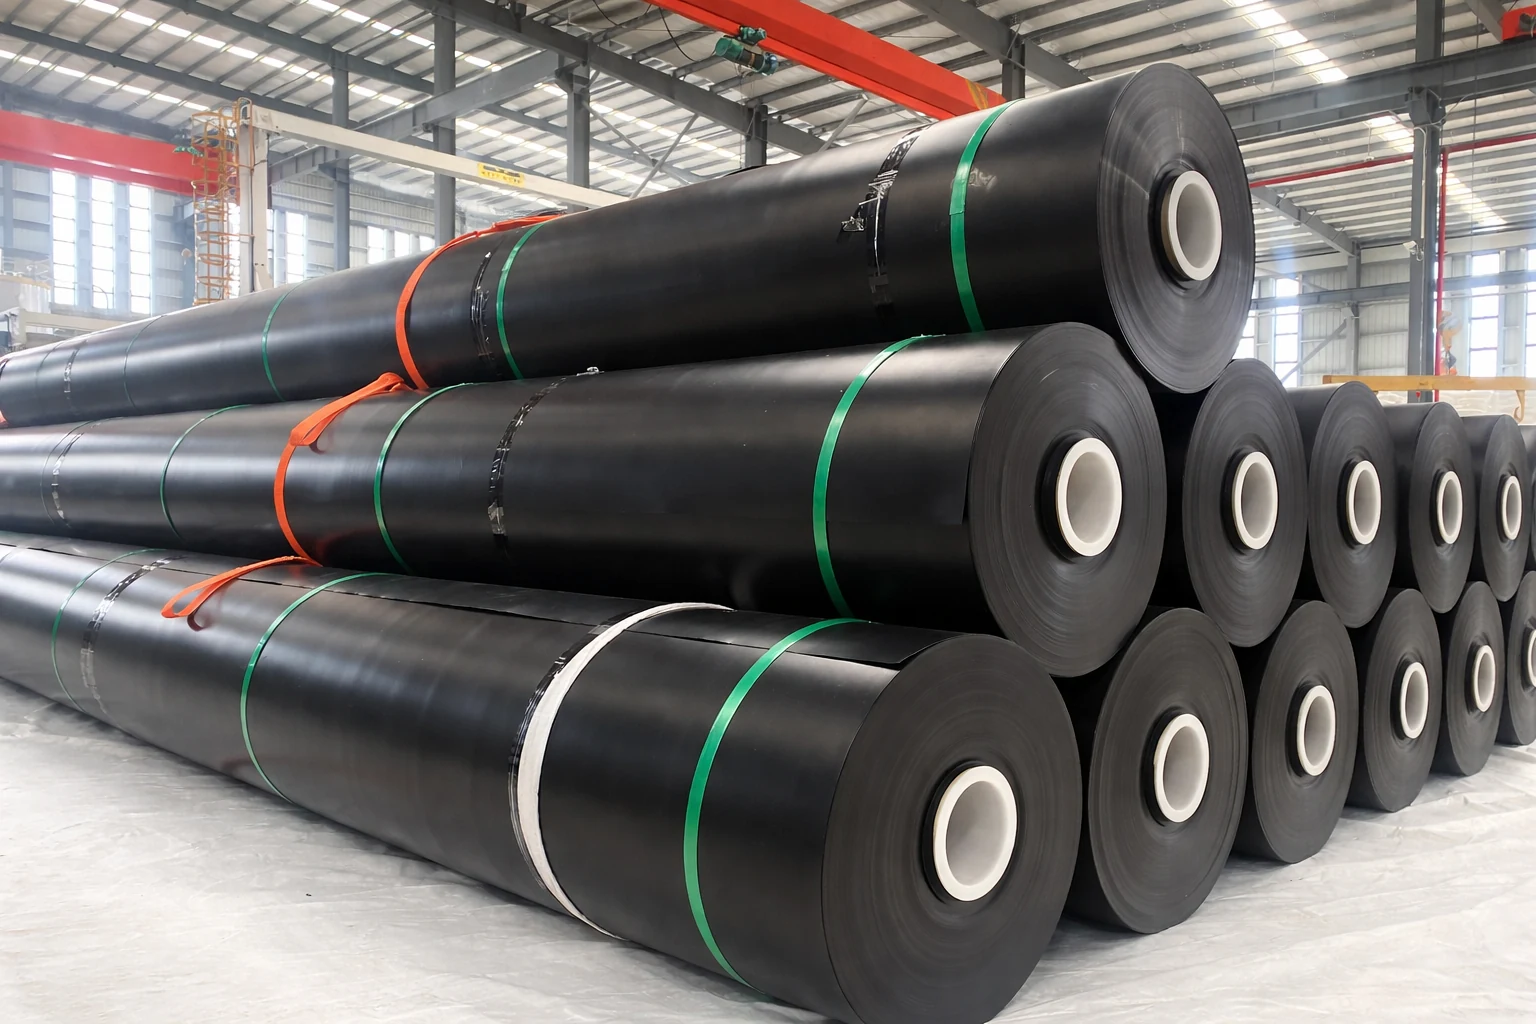
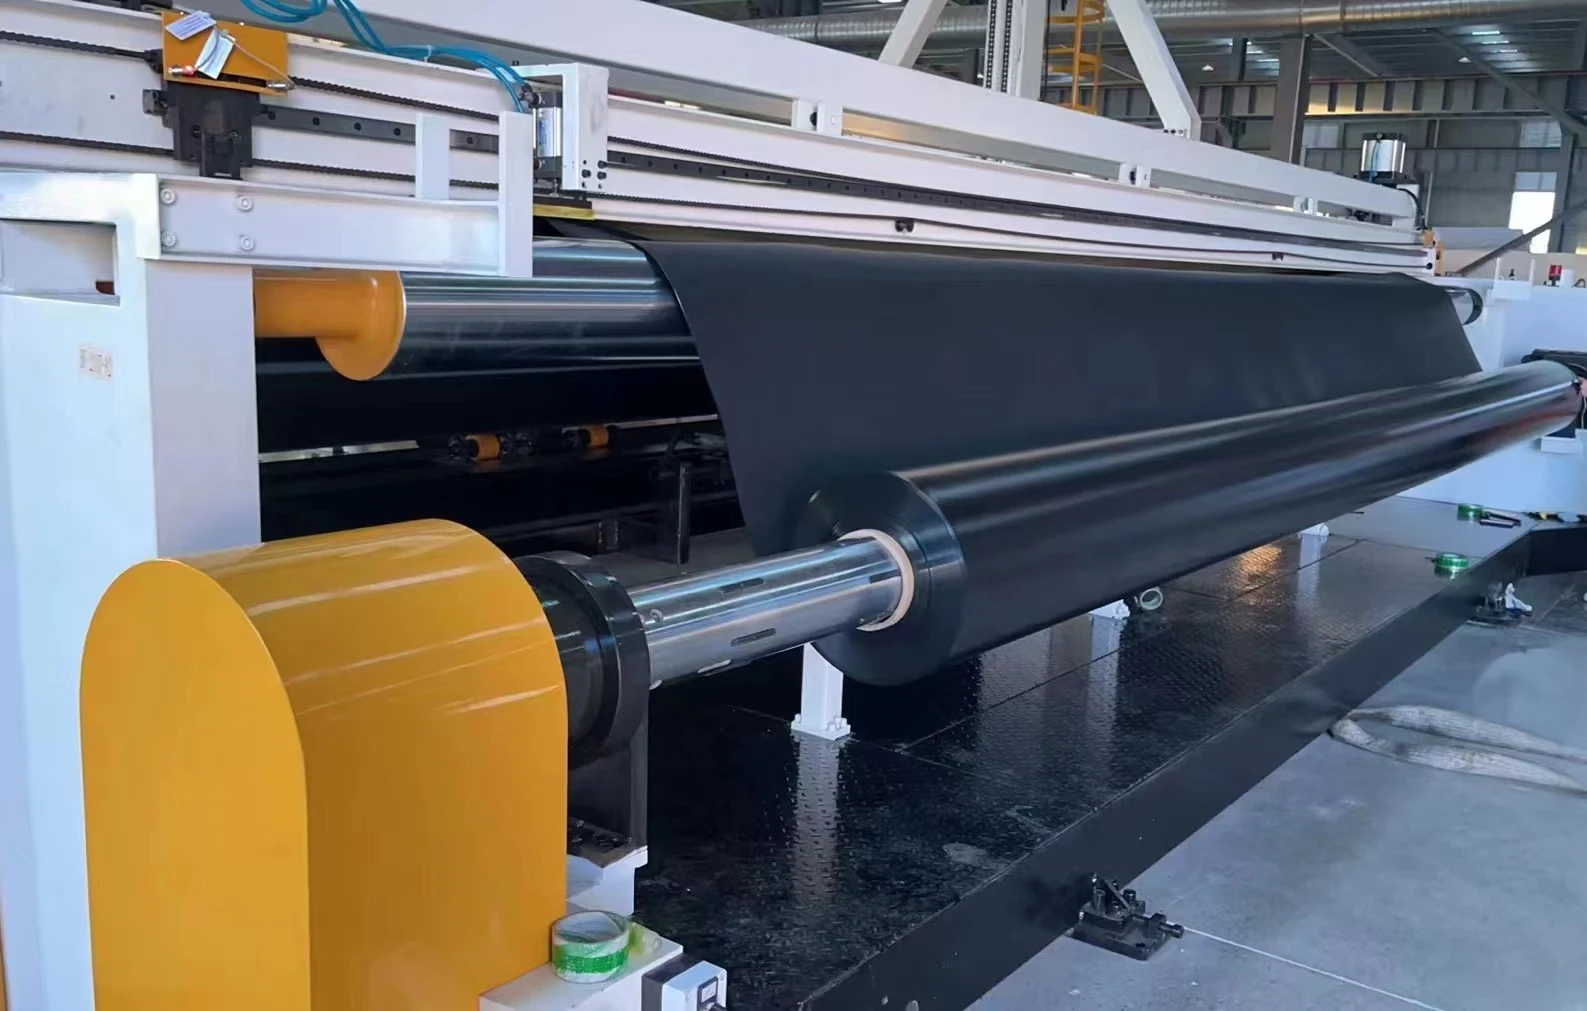
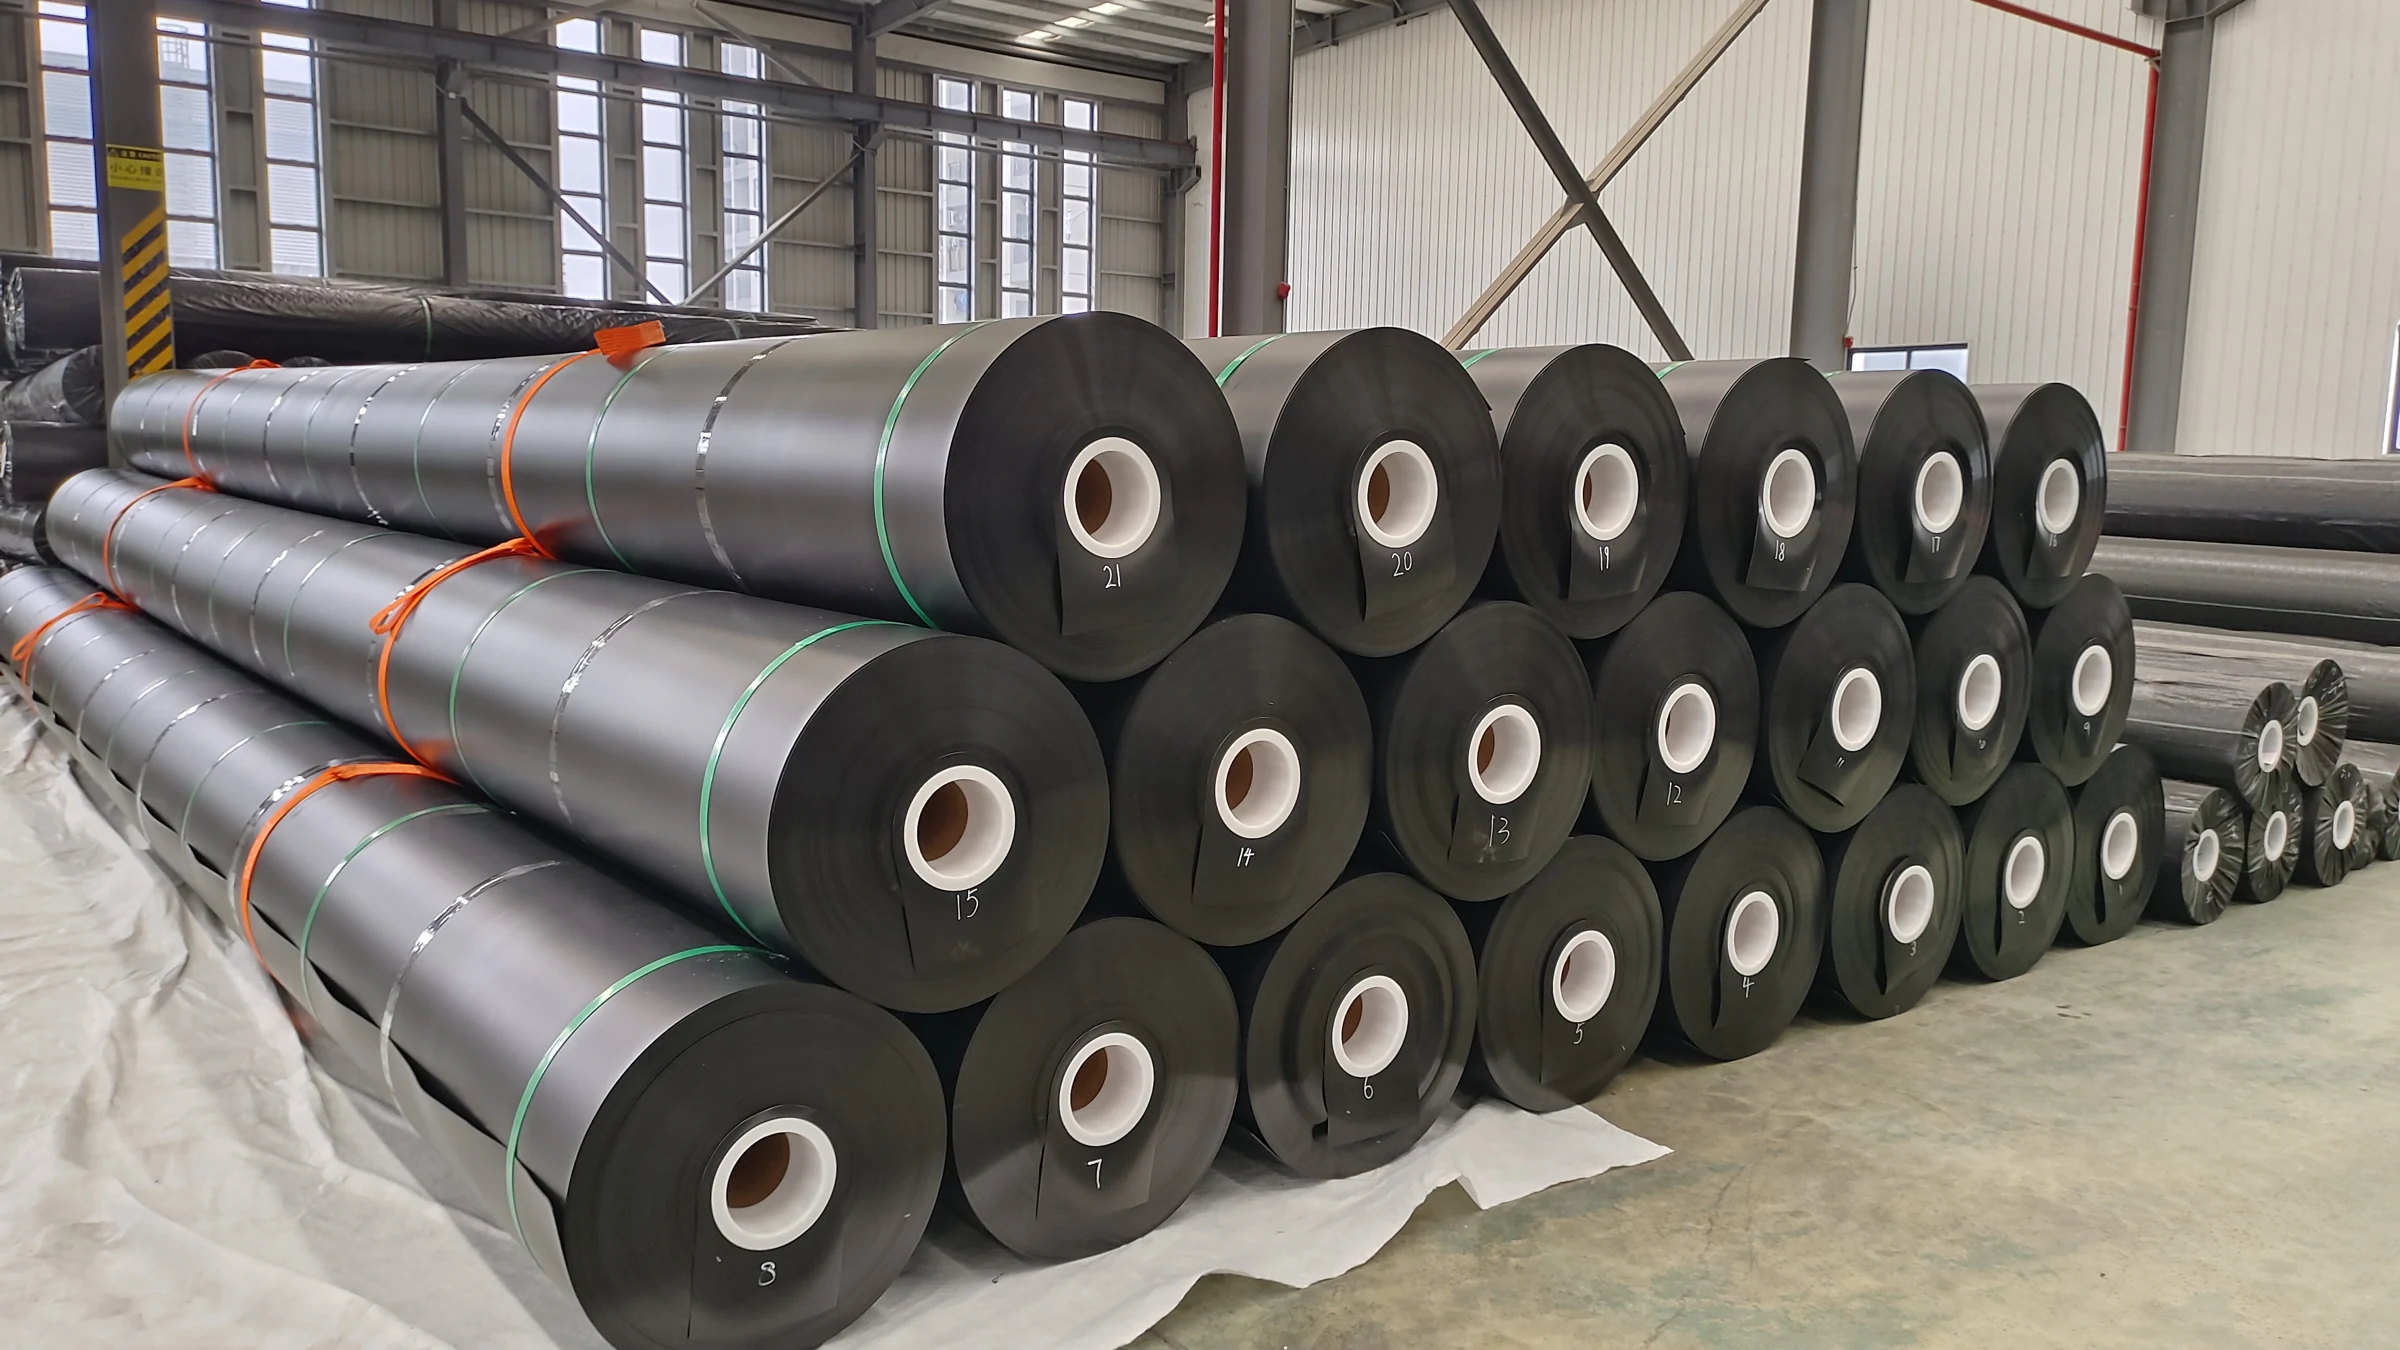
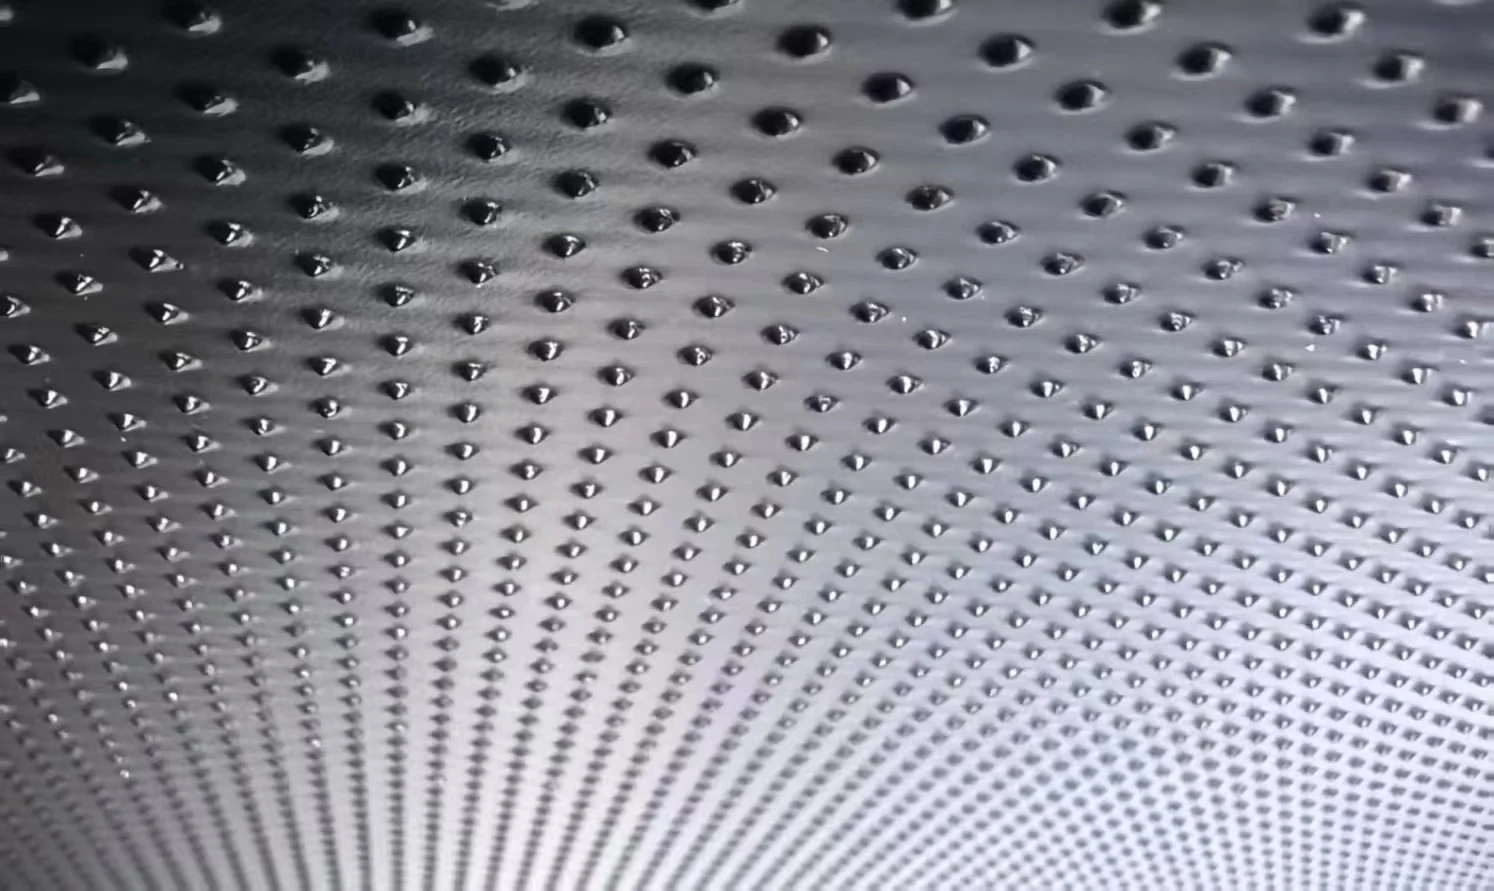
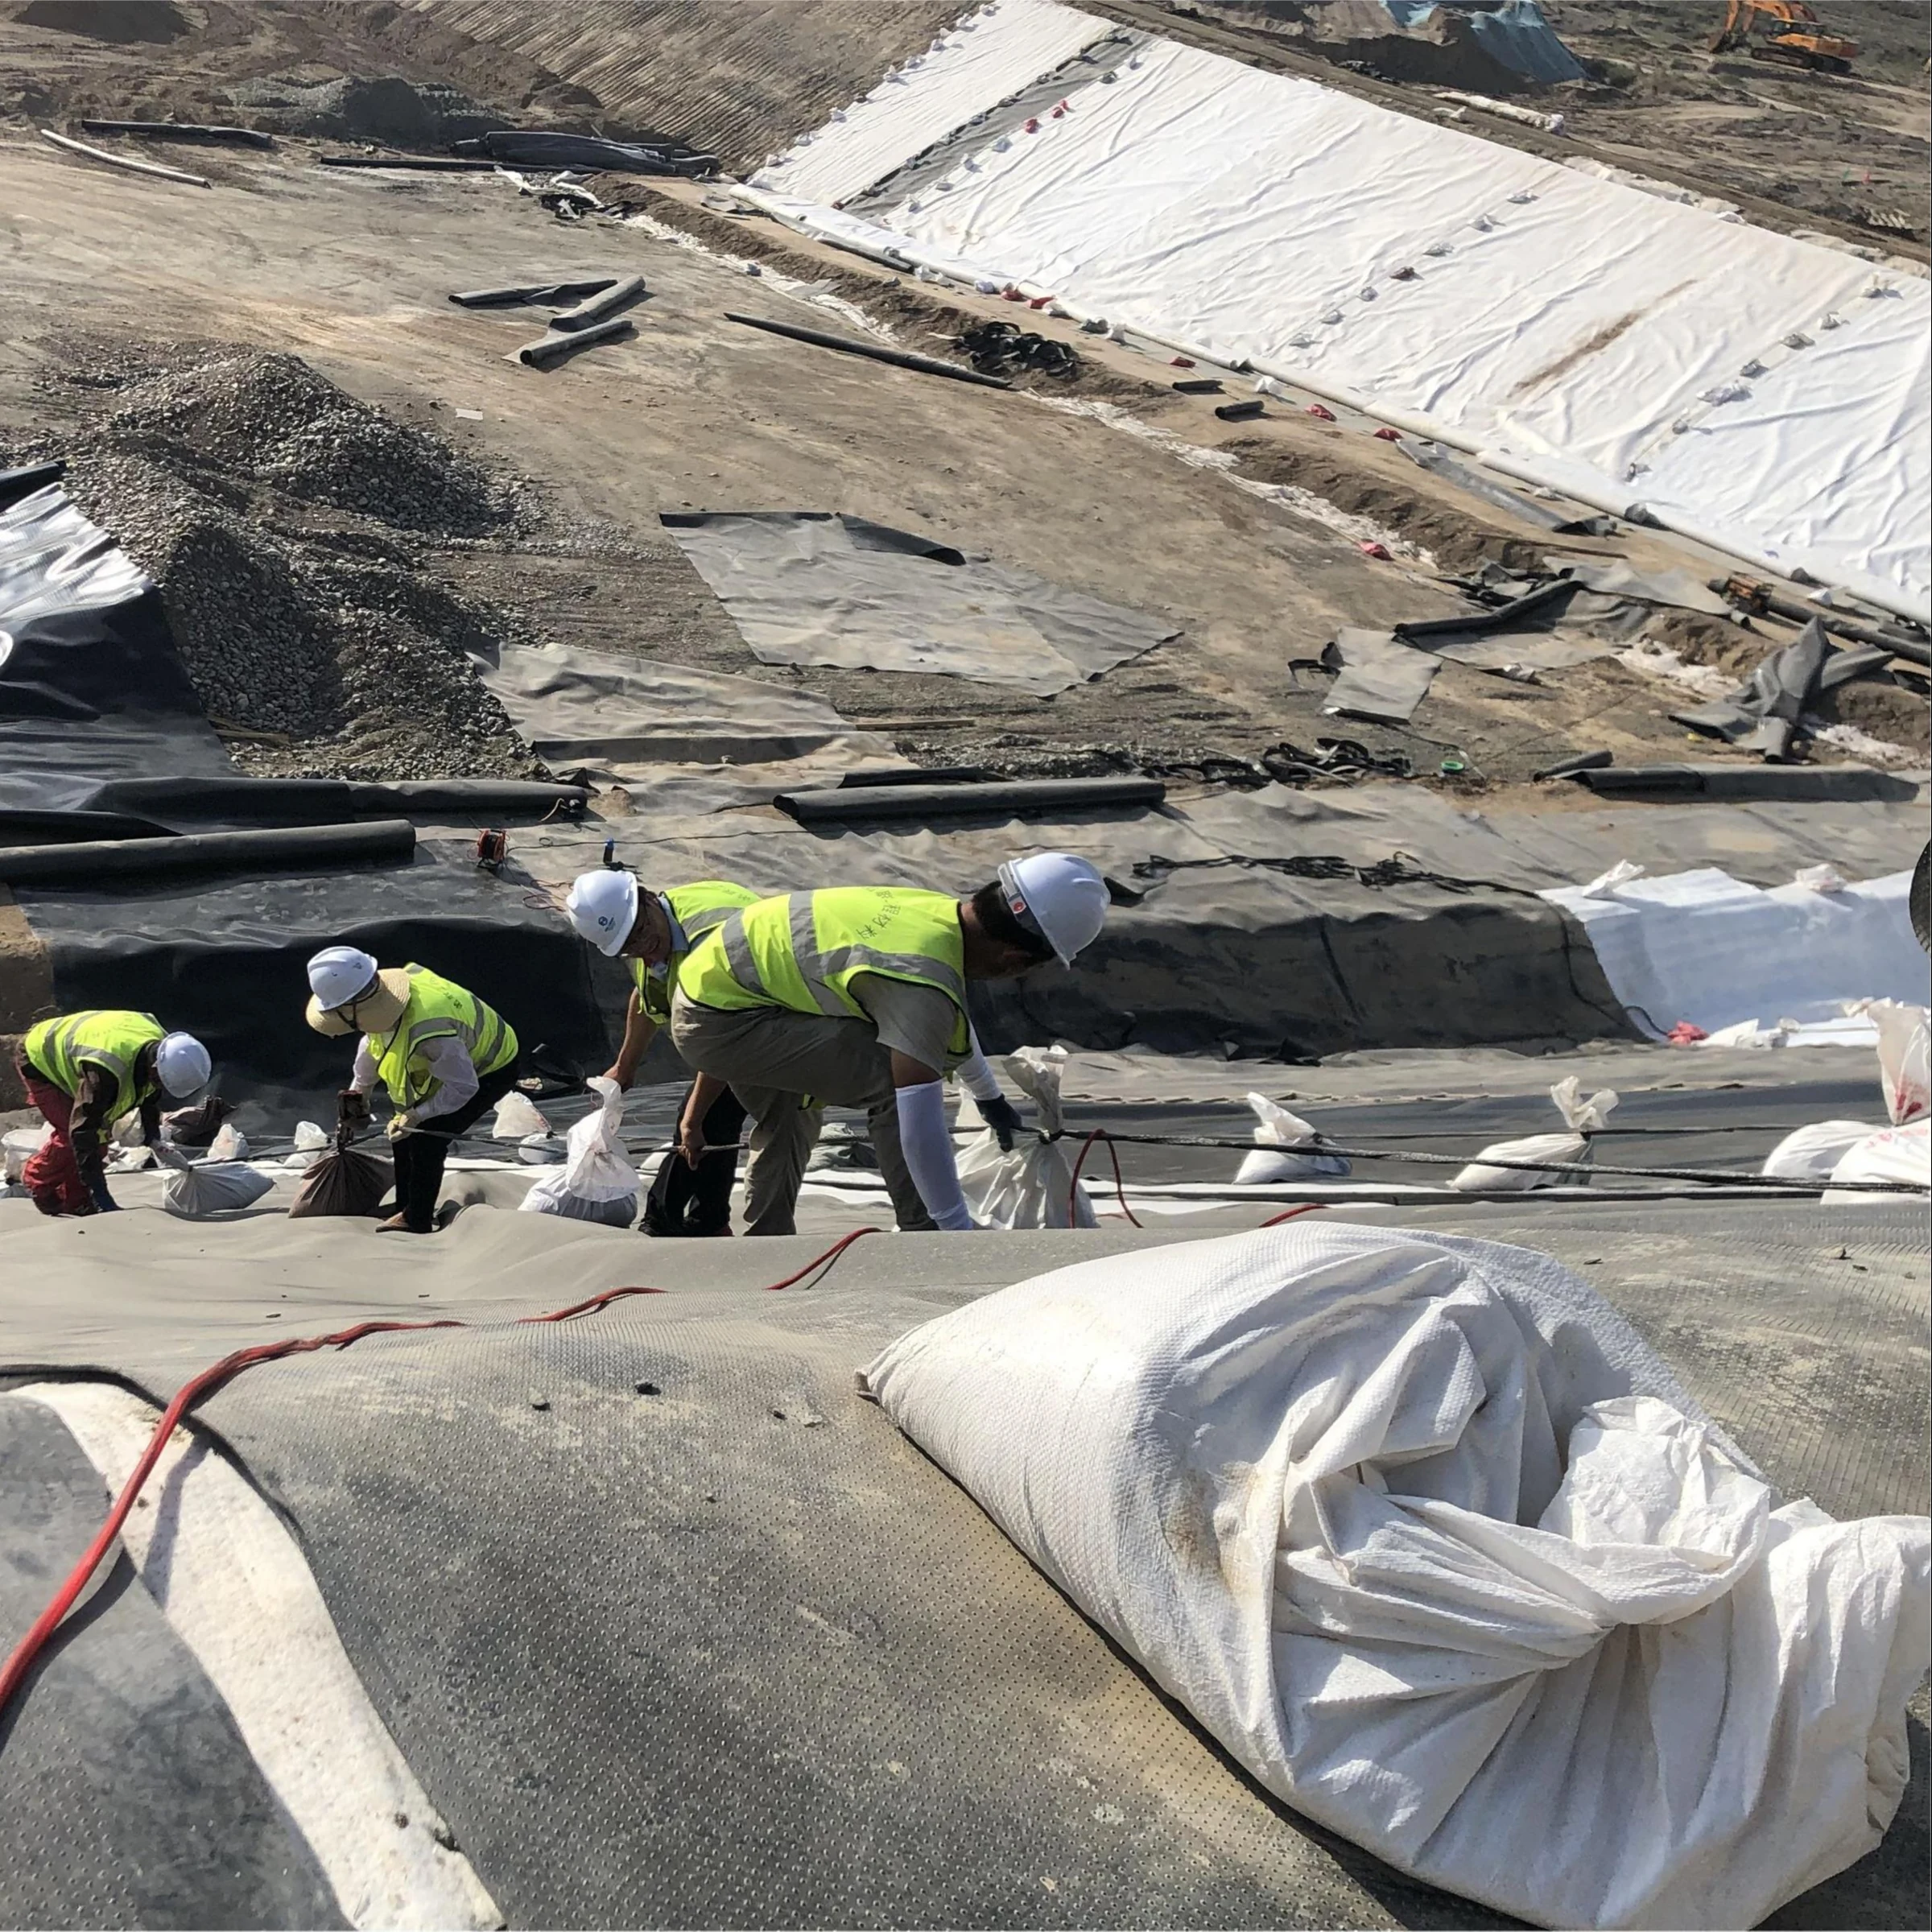

Textured, or rough, HDPE geomembrane can provide higher interface shear resistance than smooth HDPE, but the advantage must be demonstrated for the materials and conditions in the proposed lining system. Neither surface type has a universal allowable slope angle. An 18° slope is not a general dividing line between safe smooth membrane and mandatory textured membrane.
The useful comparison is between complete candidate interfaces: the exact membrane face against the proposed soil, geotextile, drainage composite or other liner component. Evaluate the measured shear response together with groundwater, cover placement, anchorage, allowable liner strain and construction quality.
Smooth and textured HDPE: what changes?
| Selection question | Smooth HDPE | Textured HDPE |
|---|---|---|
| Interface resistance | Must be measured against the actual contacting material | Texture can increase resistance, but the magnitude and post-peak behavior are product- and interface-specific |
| Surface characterization | A smooth surface does not define one friction coefficient | Asperity-height measurements describe one texture attribute, not the entire shear response |
| Sheet properties | Check the specified thickness, tensile, puncture and durability properties | Check the applicable textured-sheet requirements and manufacturing data separately |
| Seaming | Qualified welding procedure and testing are required | Coordinate seam preparation, any smooth welding margins and testing with the manufacturer |
| Selection outcome | May be suitable where the tested interface and system design satisfy requirements | May be suitable where improved interface resistance is needed and verified |
The research by Frost and Lee, published in Geosynthetics International in 2001, examined how surface texture affects geomembrane–geotextile interaction. Their tested textured interfaces showed increased peak and residual strength, with different mechanisms contributing before and after significant shearing. This supports testing the interface; it does not establish a fixed friction-angle increase for every commercial liner.
Friction angle and friction coefficient are not interchangeable numbers
For a simple frictional interface with zero adhesion intercept, the friction coefficient is μ = tan δ, where δ is the interface friction angle. Converting between them helps identify inconsistent comparisons.
| Assumed interface angle δ | Calculated coefficient tan δ |
|---|---|
| 20° | 0.364 |
| 25° | 0.466 |
| 30° | 0.577 |
| 36° | 0.727 |
These are mathematical conversions, not measured product ranges. For example, a coefficient of 0.2–0.3 corresponds to about 11.3–16.7°, not 20–25°. A table presenting both ranges as equivalent would be internally inconsistent.
Real interface envelopes may have a fitted intercept or be nonlinear over the relevant stress range. Do not extrapolate a straight-line fit into low stresses, high stresses or contact conditions that were not tested.
Why a slope angle alone cannot select the liner
A simplified cohesionless block on a dry plane gives FS = tan δ / tan β, where β is the slope angle. This model assumes only gravity and friction, with no water pressure, anchorage, additional loads, curved geometry or other potential failure surfaces.
At an illustrative 18° slope, δ = 22° gives FS ≈ 1.24, while δ = 30° gives FS ≈ 1.78. Both angles are assumptions. This calculation shows why equal slope geometry can produce different results; it does not demonstrate that either liner passes the project’s required safety factor.
For the real system, check each relevant interface and internal layer, the slope and foundation, liner tension and seams, and the anchor. A stronger textured interface can move the controlling failure surface elsewhere. Deliberately allowing the membrane to yield before sliding is not a universal safe-design rule.
Specify an interface test program that answers the design question
ASTM D5321/D5321M covers direct-shear evaluation of soil–geosynthetic and geosynthetic–geosynthetic interfaces. For interfaces involving a geosynthetic clay liner, refer to the appropriate D6243/D6243M method. State the required edition and testing conditions in the project documents.
A practical test request should identify:
- The exact liner grade, tested face and production texture, plus the actual adjacent material.
- The normal-stress range relevant to cover placement and operation.
- Moisture, hydration, consolidation and drainage conditions that represent the design cases.
- The displacement range, loading rate and direction, with the rationale for their selection.
- Full stress–displacement records, fitted envelopes, variability and the observed failure location.
Peak strength, post-peak strength at a specified displacement, and fully developed residual strength are different results. The travel of the test apparatus may limit what can be measured. Do not calculate a supposed residual angle by multiplying the peak angle by an arbitrary 0.75, or by adding a fixed two degrees to another result.
Strength selection must be compatible with the displacement expected in the system. A drainage composite or geotextile that performs well hydraulically may still introduce an interface requiring separate shear evaluation.
Texture height is an index property, not proof of slope stability
ASTM D7466/D7466M-23 measures asperity height. Its published scope explains that the method does not measure asperity spacing or the complete surface profile. It therefore cannot, by itself, establish the friction angle of a liner–soil or liner–geotextile pair.
Use manufacturing quality records to confirm that the delivered sheet matches the specified product, and use interface tests to support design strength. A material specification such as GRI-GM13 is not a site-specific slope-stability certification. Neither equal nominal thickness nor the same resin name proves that two textured products have equal shear behavior.
Likewise, a tensile stress in MPa and tensile force per unit width in kN/m are different quantities. For a uniform idealized sheet, 18 MPa multiplied by a thickness of 1.5 mm gives 27 kN/m. This conversion is only illustrative; it is not a declared tensile rating for all 1.5 mm HDPE products or an allowable design tension.
Water and construction conditions can control the result
In an effective-stress description, frictional resistance depends on the normal stress remaining after the relevant pore pressure is deducted. Drainage failure or water accumulation can therefore reduce resistance even without a change in the dry friction angle. Saturation, hydration or chemical exposure may also change the interface behavior and should be represented where relevant.
Do not assume that wetting always removes the entire textured-surface advantage, or that reducing a dry angle by 20% reproduces every wet condition. The test conditions and the hydraulic design need to be consistent.
Construction-stage review should cover temporary wind restraint, access, wrinkles, subgrade support, initial cover placement and equipment loading. Texture does not compensate for punctures, weak seams, bridging or unapproved changes in the adjacent material.
How to compare supplier quotations
Compare equivalent nominal thicknesses, surface configurations, roll dimensions, testing requirements and delivery terms. Ask whether pricing includes welding, quality assurance, protection layers, material wastage and taxes or freight. Unspecified dollar-per-square-metre ranges are not a reliable basis for a current project budget.
A defensible submittal identifies the proposed HDPE geomembrane, the exact adjacent layers, manufacturing test records and representative interface results. Review the anchor-trench design as part of the same load path. Select the surface type from this evidence and the complete stability analysis, not from a universal slope cutoff or a claimed roughness premium.